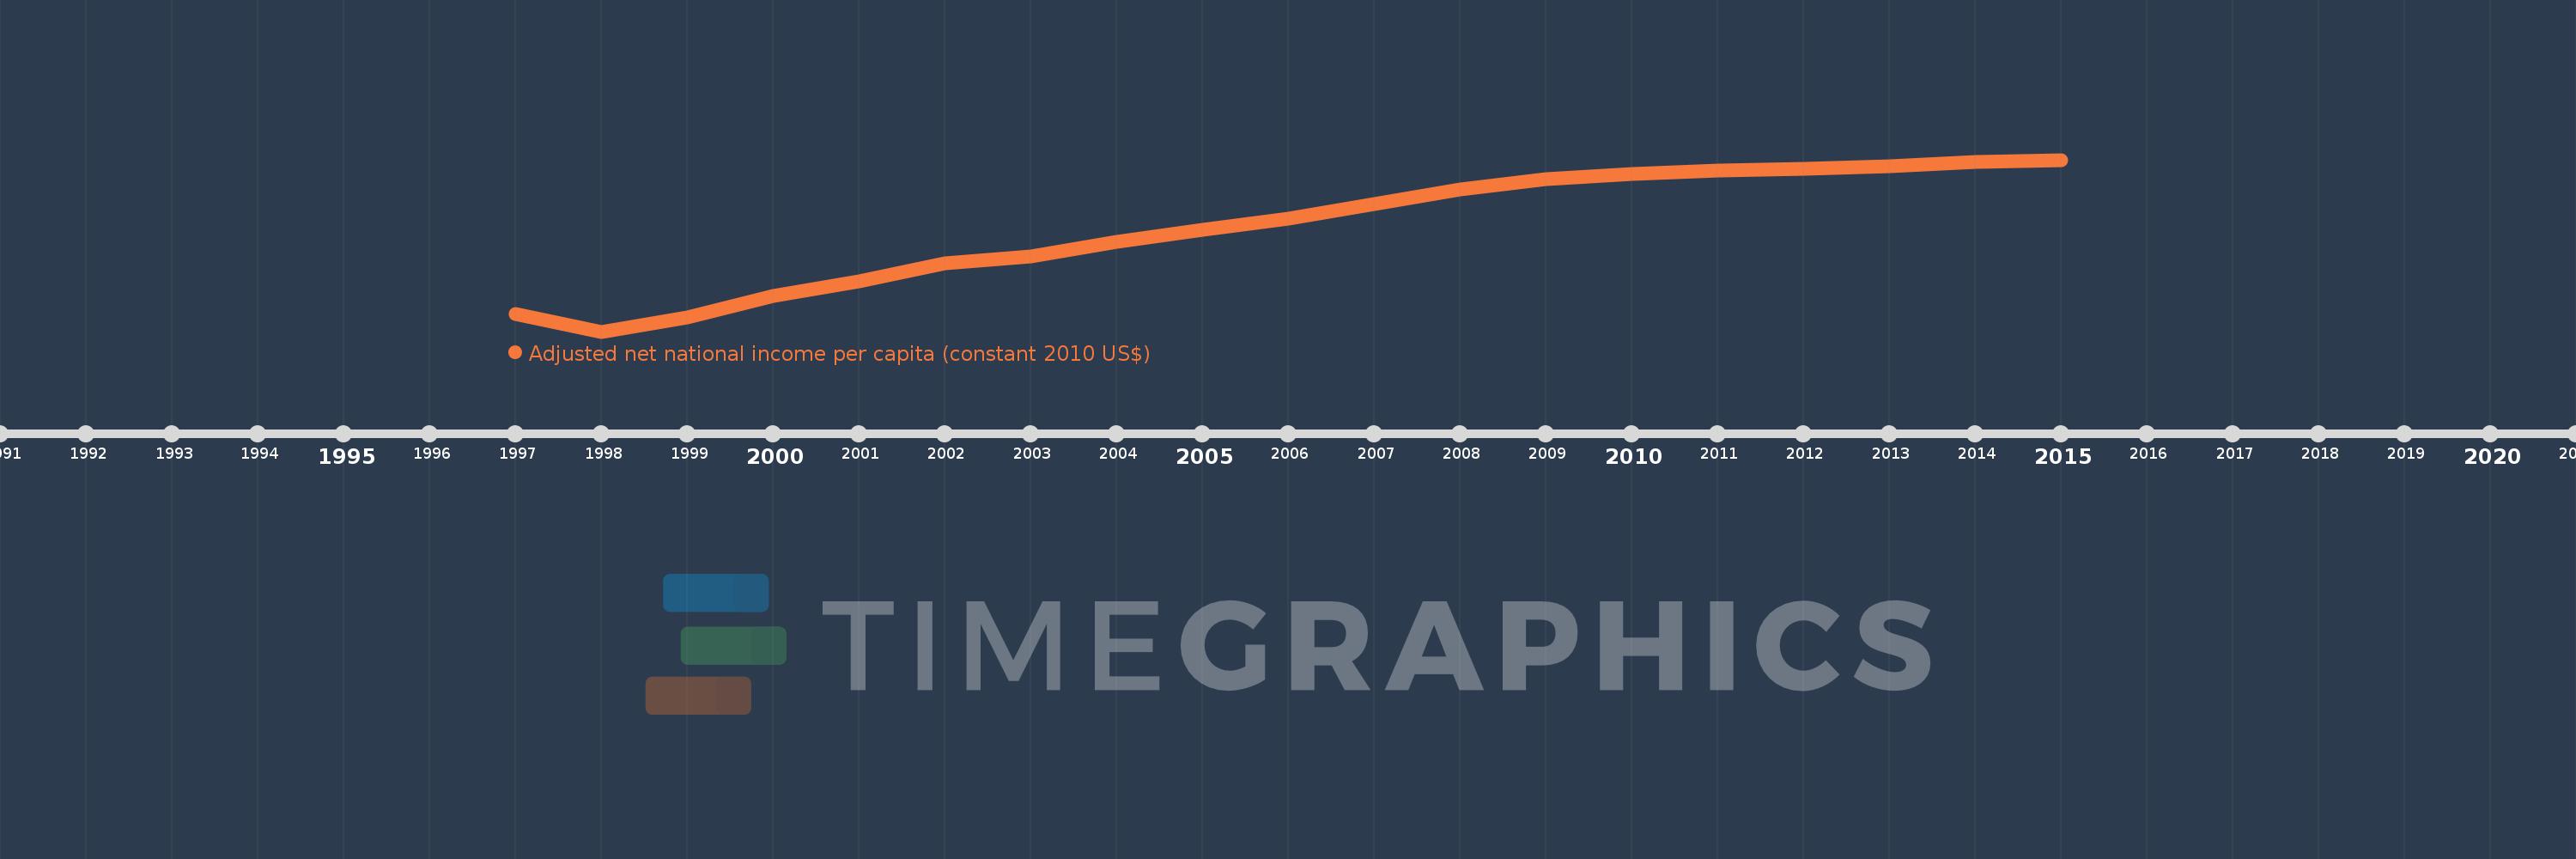
This timeline shows a graph from 1997 to 2015 of Albania. No data until 1996. Number of actual observations by date: 19.
Source name:
World Development Indicators
Source organization:
NULWorld Bank staff estimates based on sources and methods in World Bank's "The Changing Wealth of Nations: Measuring Sustainable Development in the New Millennium" (2011).L
Categories, topics:
Economy & Growth
Last updated:
apr 23, 2017
Indicators value changes by year
Meaning:
2.815K
Minimum:
1.587K
jan 1, 1998
Maximum:
3.614K
jan 1, 2015
At the date of observation
Value
Absolute change
Change from the previous value
jan 1, 1997
1.799K
+1.799K
0.0%
jan 1, 1998
1.587K
-211.502
-11.76%
jan 1, 1999
1.759K
+171.437
10.8%
jan 1, 2000
2.01K
+250.719
14.25%
jan 1, 2001
2.179K
+169.292
8.42%
jan 1, 2002
2.39K
+210.699
9.67%
jan 1, 2003
2.472K
+81.884
3.43%
jan 1, 2004
2.645K
+173.595
7.02%
jan 1, 2005
2.793K
+148.323
5.61%
jan 1, 2006
2.918K
+124.704
4.46%
jan 1, 2007
3.091K
+172.389
5.91%
jan 1, 2008
3.267K
+176.28
5.7%
jan 1, 2009
3.387K
+119.769
3.67%
jan 1, 2010
3.448K
+61.019
1.8%
jan 1, 2011
3.491K
+43.399
1.26%
jan 1, 2012
3.506K
+14.9
0.43%
jan 1, 2013
3.539K
+33.447
0.95%
jan 1, 2014
3.588K
+48.605
1.37%
jan 1, 2015
3.614K
+26.527
0.74%
Ranking of countries by current statistics by years