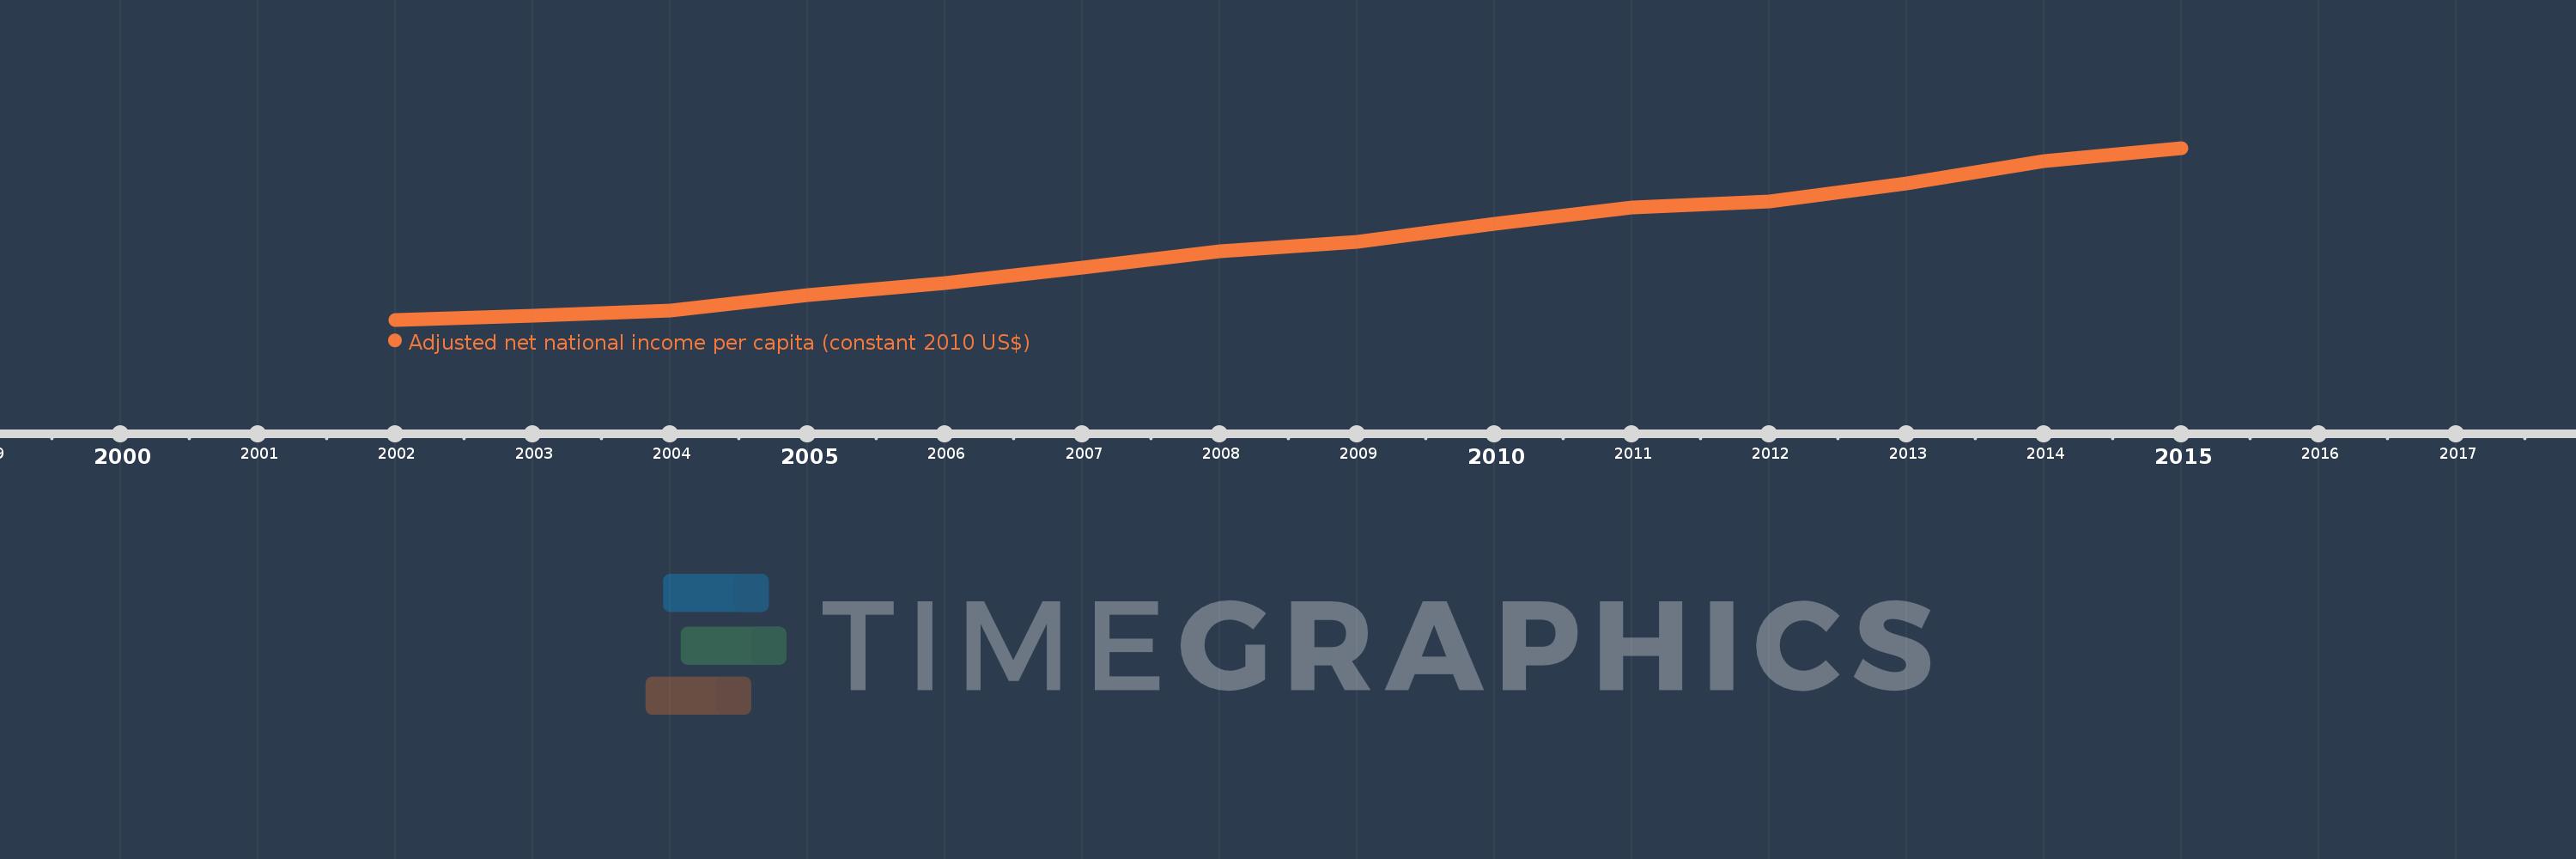
This timeline shows a graph from 2002 to 2015 of IDA only. No data until 2001. Number of actual observations by date: 14.
Source name:
World Development Indicators
Source organization:
NULWorld Bank staff estimates based on sources and methods in World Bank's "The Changing Wealth of Nations: Measuring Sustainable Development in the New Millennium" (2011).L
Categories, topics:
Economy & Growth
Last updated:
apr 23, 2017
Indicators value changes by year
Meaning:
630.189
Minimum:
528.296
jan 1, 2002
Maximum:
758.186
jan 1, 2015
At the date of observation
Value
Absolute change
Change from the previous value
jan 1, 2002
528.296
+528.296
0.0%
jan 1, 2003
533.401
+5.105
0.97%
jan 1, 2004
541.037
+7.636
1.43%
jan 1, 2005
561.571
+20.534
3.8%
jan 1, 2006
576.957
+15.386
2.74%
jan 1, 2007
598.015
+21.058
3.65%
jan 1, 2008
620.453
+22.437
3.75%
jan 1, 2009
632.34
+11.888
1.92%
jan 1, 2010
656.259
+23.918
3.78%
jan 1, 2011
678.384
+22.125
3.37%
jan 1, 2012
686.958
+8.574
1.26%
jan 1, 2013
710.465
+23.507
3.42%
jan 1, 2014
740.322
+29.857
4.2%
jan 1, 2015
758.186
+17.863
2.41%
Ranking of countries by current statistics by years