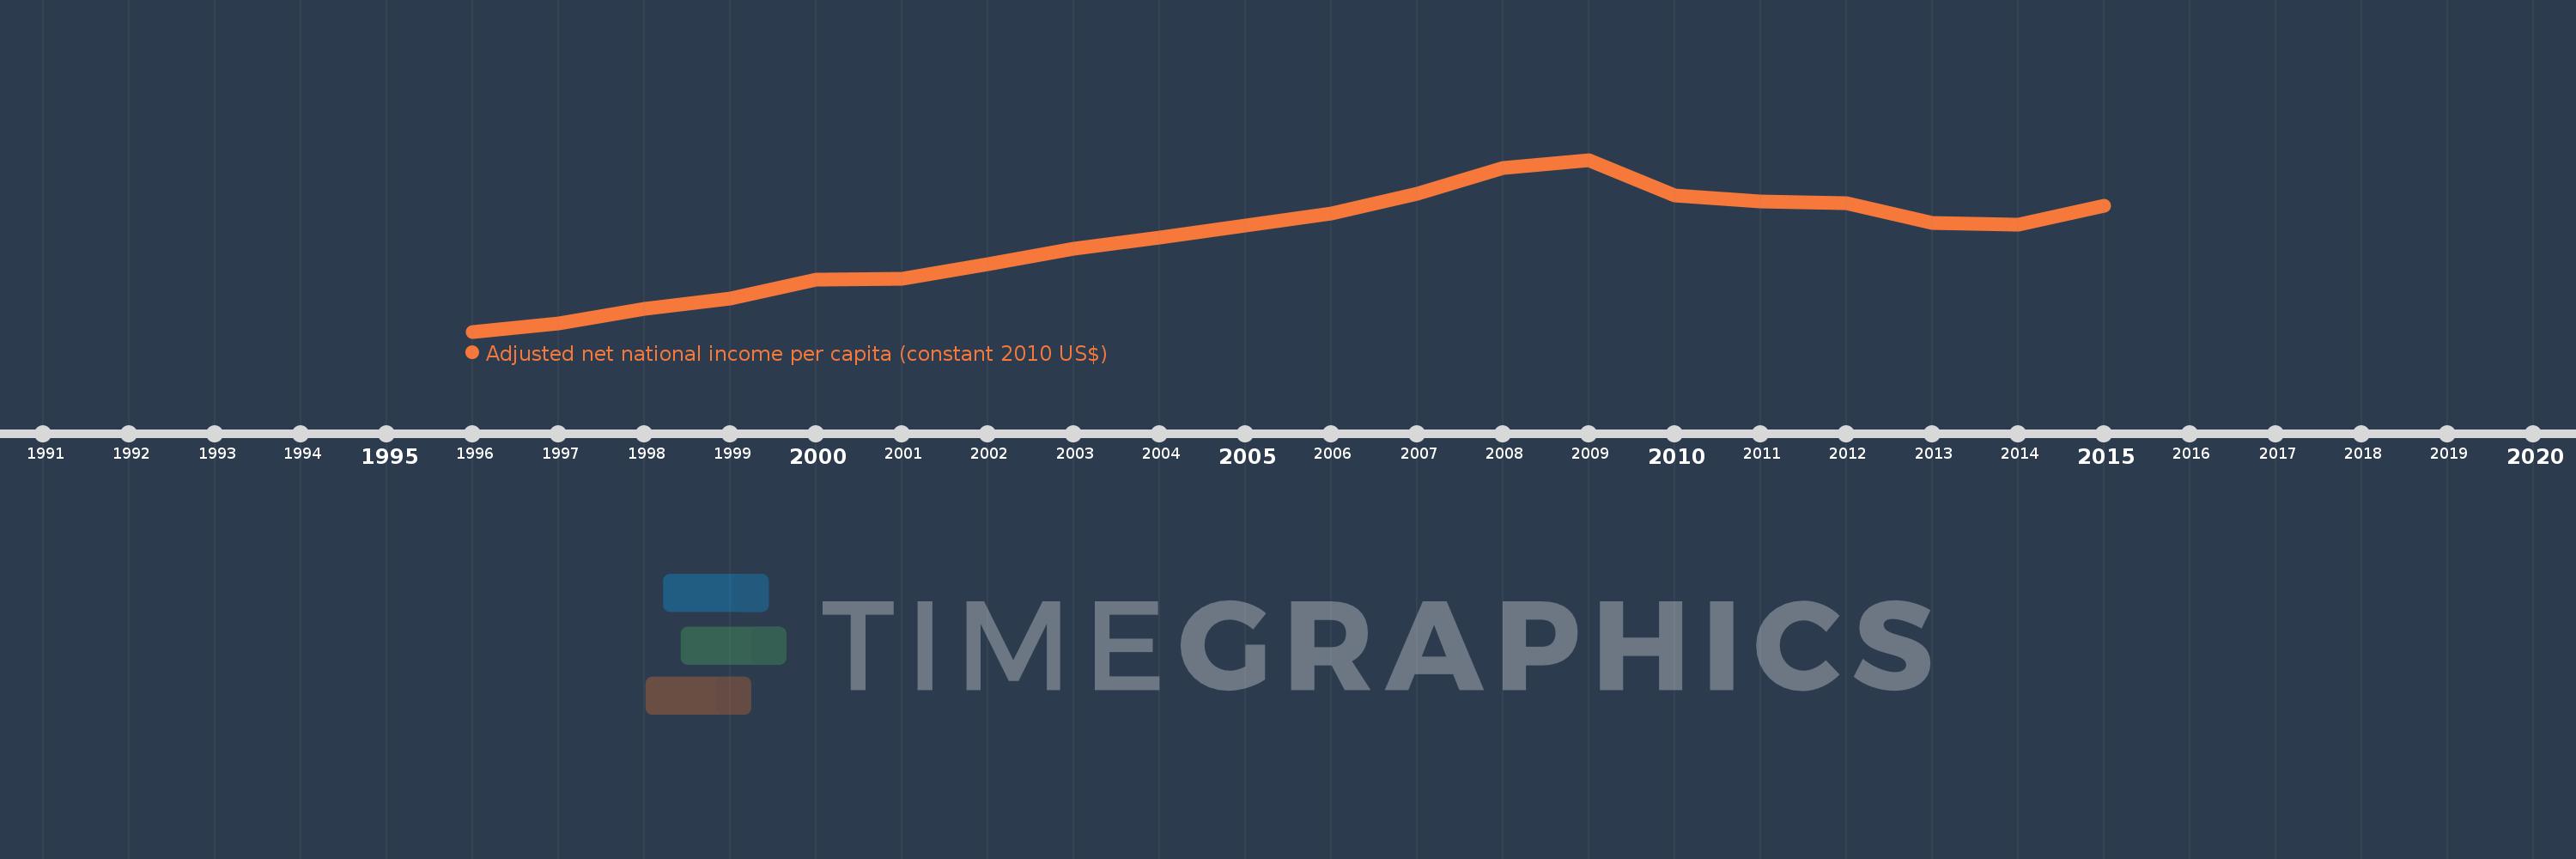
This timeline shows a graph from 1996 to 2015 of Slovenia. No data until 1995. Number of actual observations by date: 20.
Source name:
World Development Indicators
Source organization:
NULWorld Bank staff estimates based on sources and methods in World Bank's "The Changing Wealth of Nations: Measuring Sustainable Development in the New Millennium" (2011).L
Categories, topics:
Economy & Growth
Last updated:
apr 23, 2017
Indicators value changes by year
Meaning:
16.751K
Minimum:
12.516K
jan 1, 1996
Maximum:
20.393K
jan 1, 2009
At the date of observation
Value
Absolute change
Change from the previous value
jan 1, 1996
12.516K
+12.516K
0.0%
jan 1, 1997
12.9K
+384.009
3.07%
jan 1, 1998
13.574K
+674.356
5.23%
jan 1, 1999
14.052K
+477.623
3.52%
jan 1, 2000
14.889K
+836.781
5.95%
jan 1, 2001
14.933K
+44.084
0.3%
jan 1, 2002
15.603K
+670.715
4.49%
jan 1, 2003
16.328K
+724.278
4.64%
jan 1, 2004
16.821K
+492.92
3.02%
jan 1, 2005
17.368K
+547.395
3.25%
jan 1, 2006
17.92K
+551.962
3.18%
jan 1, 2007
18.822K
+902.522
5.04%
jan 1, 2008
20.036K
+1.213K
6.45%
jan 1, 2009
20.393K
+357.439
1.78%
jan 1, 2010
18.778K
-1.615K
-7.92%
jan 1, 2011
18.485K
-292.688
-1.56%
jan 1, 2012
18.388K
-97.675
-0.53%
jan 1, 2013
17.507K
-880.661
-4.79%
jan 1, 2014
17.426K
-80.589
-0.46%
jan 1, 2015
18.29K
+863.614
4.96%
Ranking of countries by current statistics by years