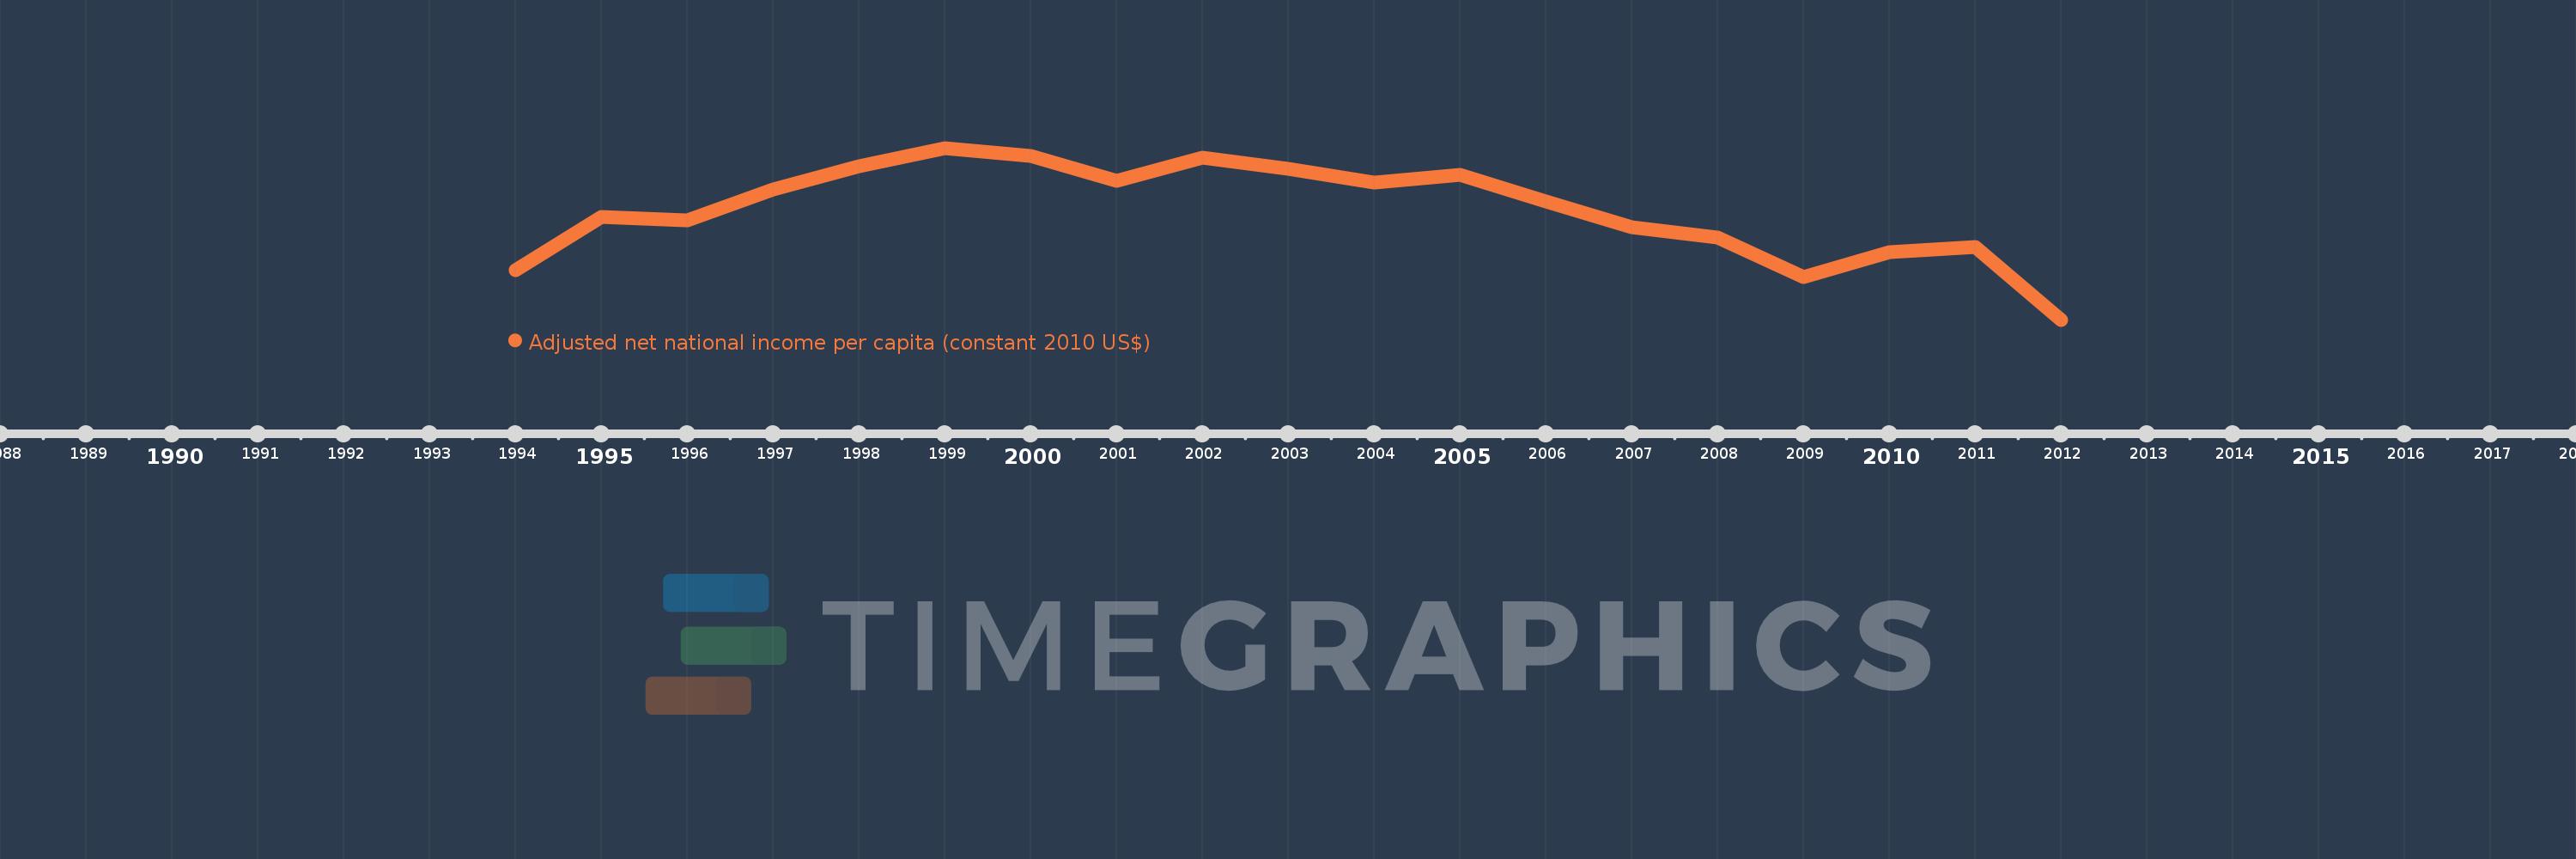
This timeline shows a graph from 1994 to 2012 of Eritrea. No data until 1993. Number of actual observations by date: 19.
Source name:
World Development Indicators
Source organization:
NULWorld Bank staff estimates based on sources and methods in World Bank's "The Changing Wealth of Nations: Measuring Sustainable Development in the New Millennium" (2011).L
Categories, topics:
Economy & Growth
Last updated:
apr 23, 2017
Indicators value changes by year
Meaning:
437.673
Minimum:
312.002
jan 1, 2012
Maximum:
509.135
jan 1, 1999
At the date of observation
Value
Absolute change
Change from the previous value
jan 1, 1994
368.928
+368.928
0.0%
jan 1, 1995
429.86
+60.932
16.52%
jan 1, 1996
425.697
-4.163
-0.97%
jan 1, 1997
461.875
+36.178
8.5%
jan 1, 1998
487.904
+26.029
5.64%
jan 1, 1999
509.135
+21.231
4.35%
jan 1, 2000
499.819
-9.315
-1.83%
jan 1, 2001
471.695
-28.124
-5.63%
jan 1, 2002
498.147
+26.452
5.61%
jan 1, 2003
485.292
-12.856
-2.58%
jan 1, 2004
469.12
-16.172
-3.33%
jan 1, 2005
478.21
+9.09
1.94%
jan 1, 2006
447.736
-30.474
-6.37%
jan 1, 2007
418.205
-29.531
-6.6%
jan 1, 2008
406.396
-11.809
-2.82%
jan 1, 2009
361.333
-45.062
-11.09%
jan 1, 2010
389.32
+27.986
7.75%
jan 1, 2011
395.11
+5.79
1.49%
jan 1, 2012
312.002
-83.108
-21.03%
Ranking of countries by current statistics by years