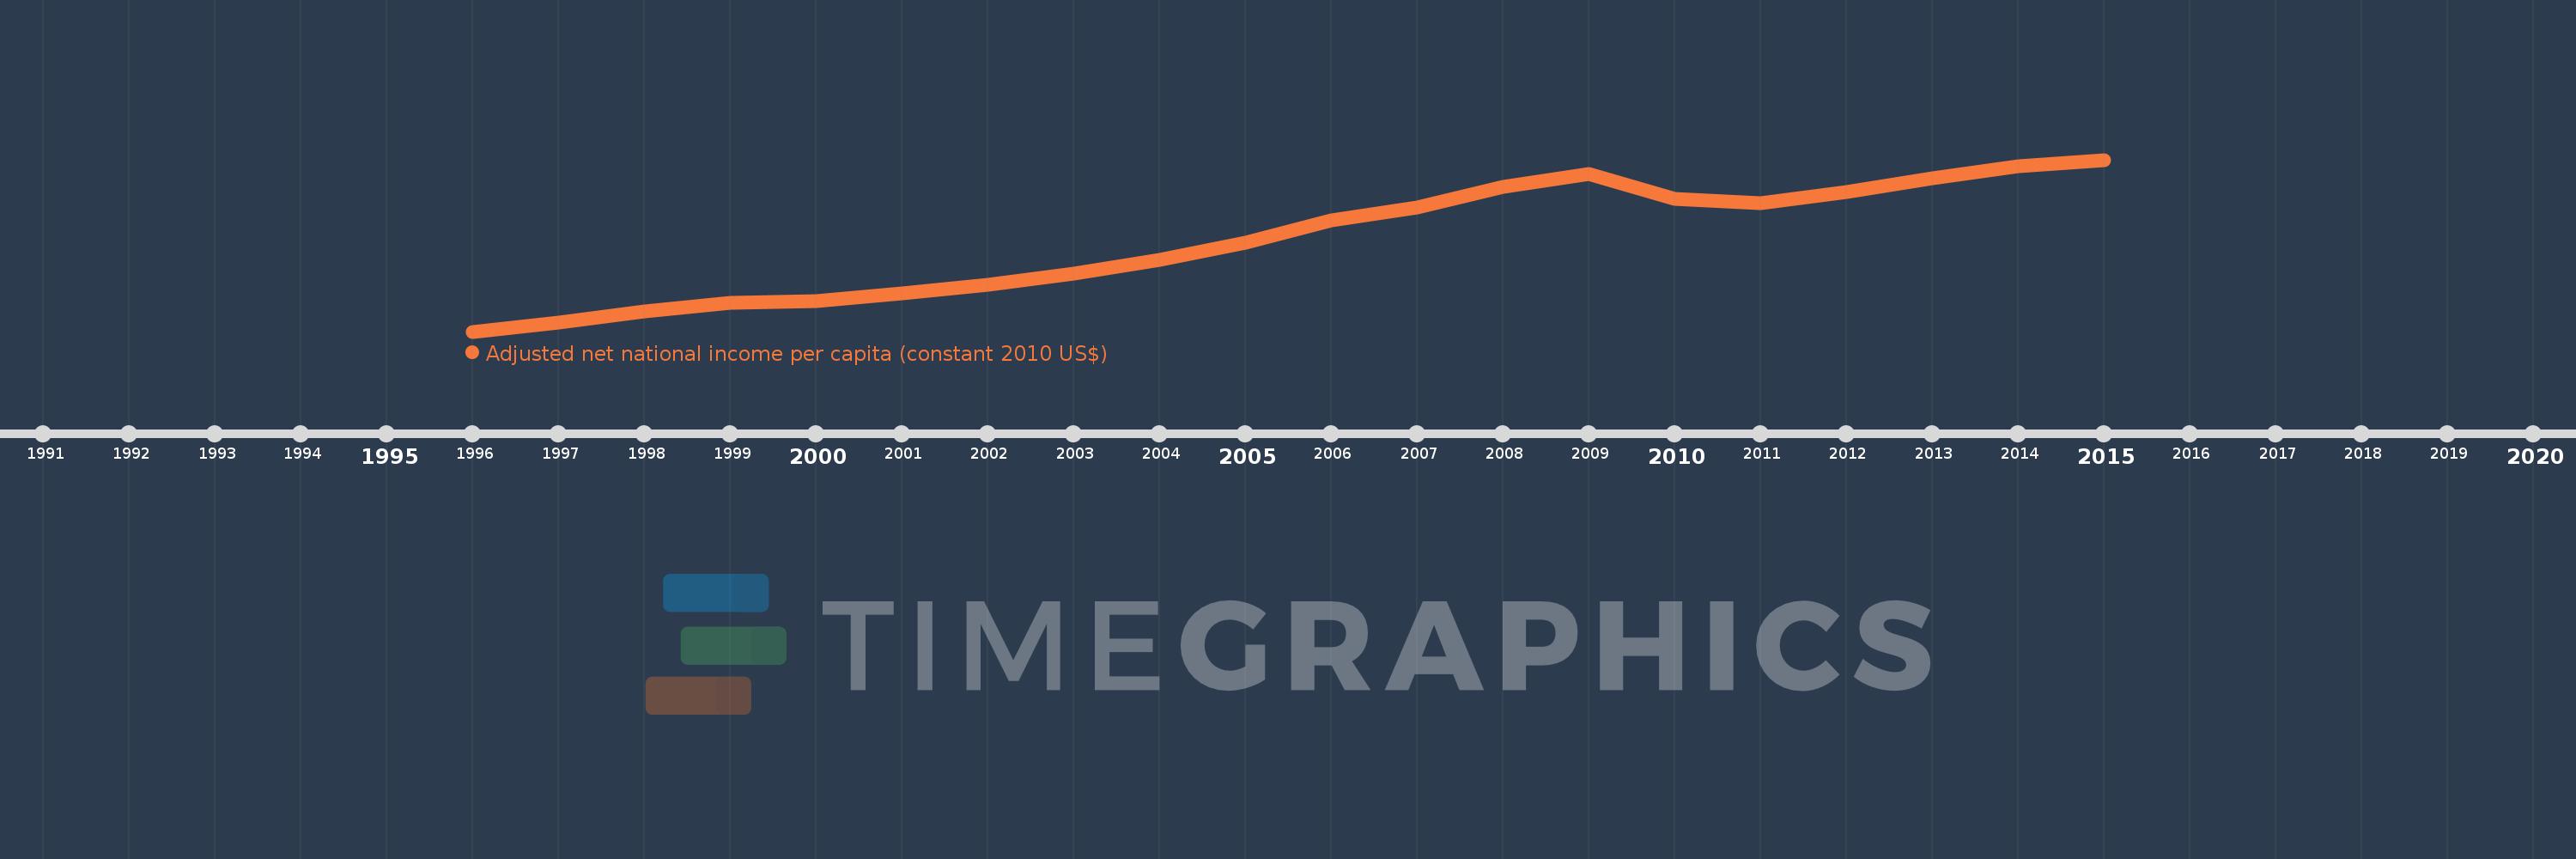
This timeline shows a graph from 1996 to 2015 of Lithuania. No data until 1995. Number of actual observations by date: 20.
Source name:
World Development Indicators
Source organization:
NULWorld Bank staff estimates based on sources and methods in World Bank's "The Changing Wealth of Nations: Measuring Sustainable Development in the New Millennium" (2011).L
Categories, topics:
Economy & Growth
Last updated:
apr 23, 2017
Indicators value changes by year
Meaning:
8.071K
Minimum:
3.588K
jan 1, 1996
Maximum:
12.04K
jan 1, 2015
At the date of observation
Value
Absolute change
Change from the previous value
jan 1, 1996
3.588K
+3.588K
0.0%
jan 1, 1997
4.042K
+453.961
12.65%
jan 1, 1998
4.59K
+548.011
13.56%
jan 1, 1999
5.023K
+432.749
9.43%
jan 1, 2000
5.086K
+63.38
1.26%
jan 1, 2001
5.455K
+368.677
7.25%
jan 1, 2002
5.899K
+444.786
8.15%
jan 1, 2003
6.431K
+531.852
9.02%
jan 1, 2004
7.111K
+680.079
10.57%
jan 1, 2005
7.968K
+856.289
12.04%
jan 1, 2006
9.075K
+1.108K
13.9%
jan 1, 2007
9.696K
+620.114
6.83%
jan 1, 2008
10.71K
+1.015K
10.47%
jan 1, 2009
11.34K
+629.215
5.87%
jan 1, 2010
10.133K
-1.206K
-10.64%
jan 1, 2011
9.914K
-219.045
-2.16%
jan 1, 2012
10.461K
+546.35
5.51%
jan 1, 2013
11.111K
+650.713
6.22%
jan 1, 2014
11.738K
+626.798
5.64%
jan 1, 2015
12.04K
+302.264
2.58%
Ranking of countries by current statistics by years