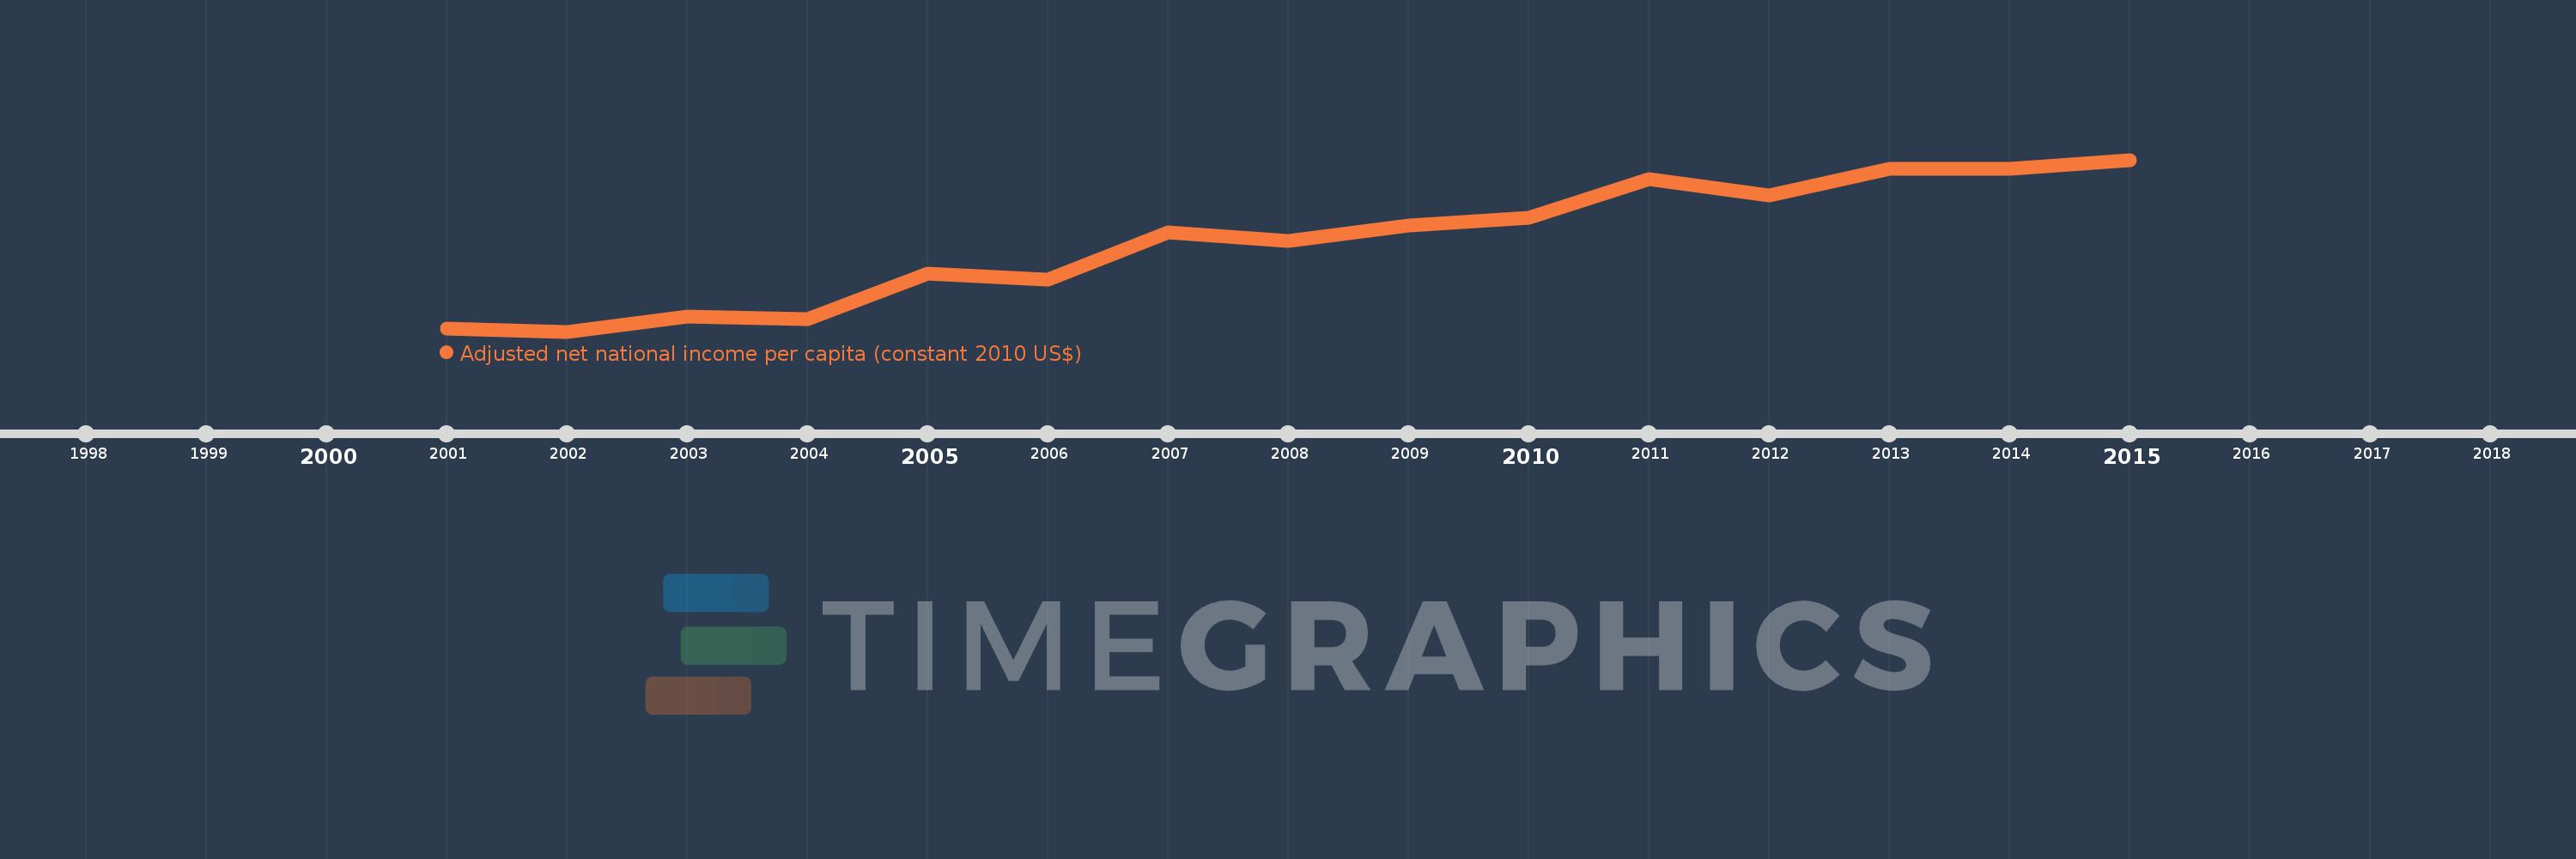
This timeline shows a graph from 2001 to 2015 of Nigeria. No data until 2000. Number of actual observations by date: 15.
Source name:
World Development Indicators
Source organization:
NULWorld Bank staff estimates based on sources and methods in World Bank's "The Changing Wealth of Nations: Measuring Sustainable Development in the New Millennium" (2011).L
Categories, topics:
Economy & Growth
Last updated:
apr 23, 2017
Indicators value changes by year
Meaning:
1.422K
Minimum:
799.281
jan 1, 2002
Maximum:
1.999K
jan 1, 2015
At the date of observation
Value
Absolute change
Change from the previous value
jan 1, 2001
821.519
+821.519
0.0%
jan 1, 2002
799.281
-22.238
-2.71%
jan 1, 2003
906.818
+107.537
13.45%
jan 1, 2004
888.505
-18.313
-2.02%
jan 1, 2005
1.204K
+315.347
35.49%
jan 1, 2006
1.165K
-39.204
-3.26%
jan 1, 2007
1.49K
+325.417
27.94%
jan 1, 2008
1.43K
-60.417
-4.05%
jan 1, 2009
1.538K
+108.32
7.58%
jan 1, 2010
1.594K
+56.078
3.65%
jan 1, 2011
1.866K
+271.886
17.06%
jan 1, 2012
1.752K
-113.973
-6.11%
jan 1, 2013
1.939K
+186.884
10.67%
jan 1, 2014
1.937K
-2.031
-0.1%
jan 1, 2015
1.999K
+62.254
3.21%
Ranking of countries by current statistics by years