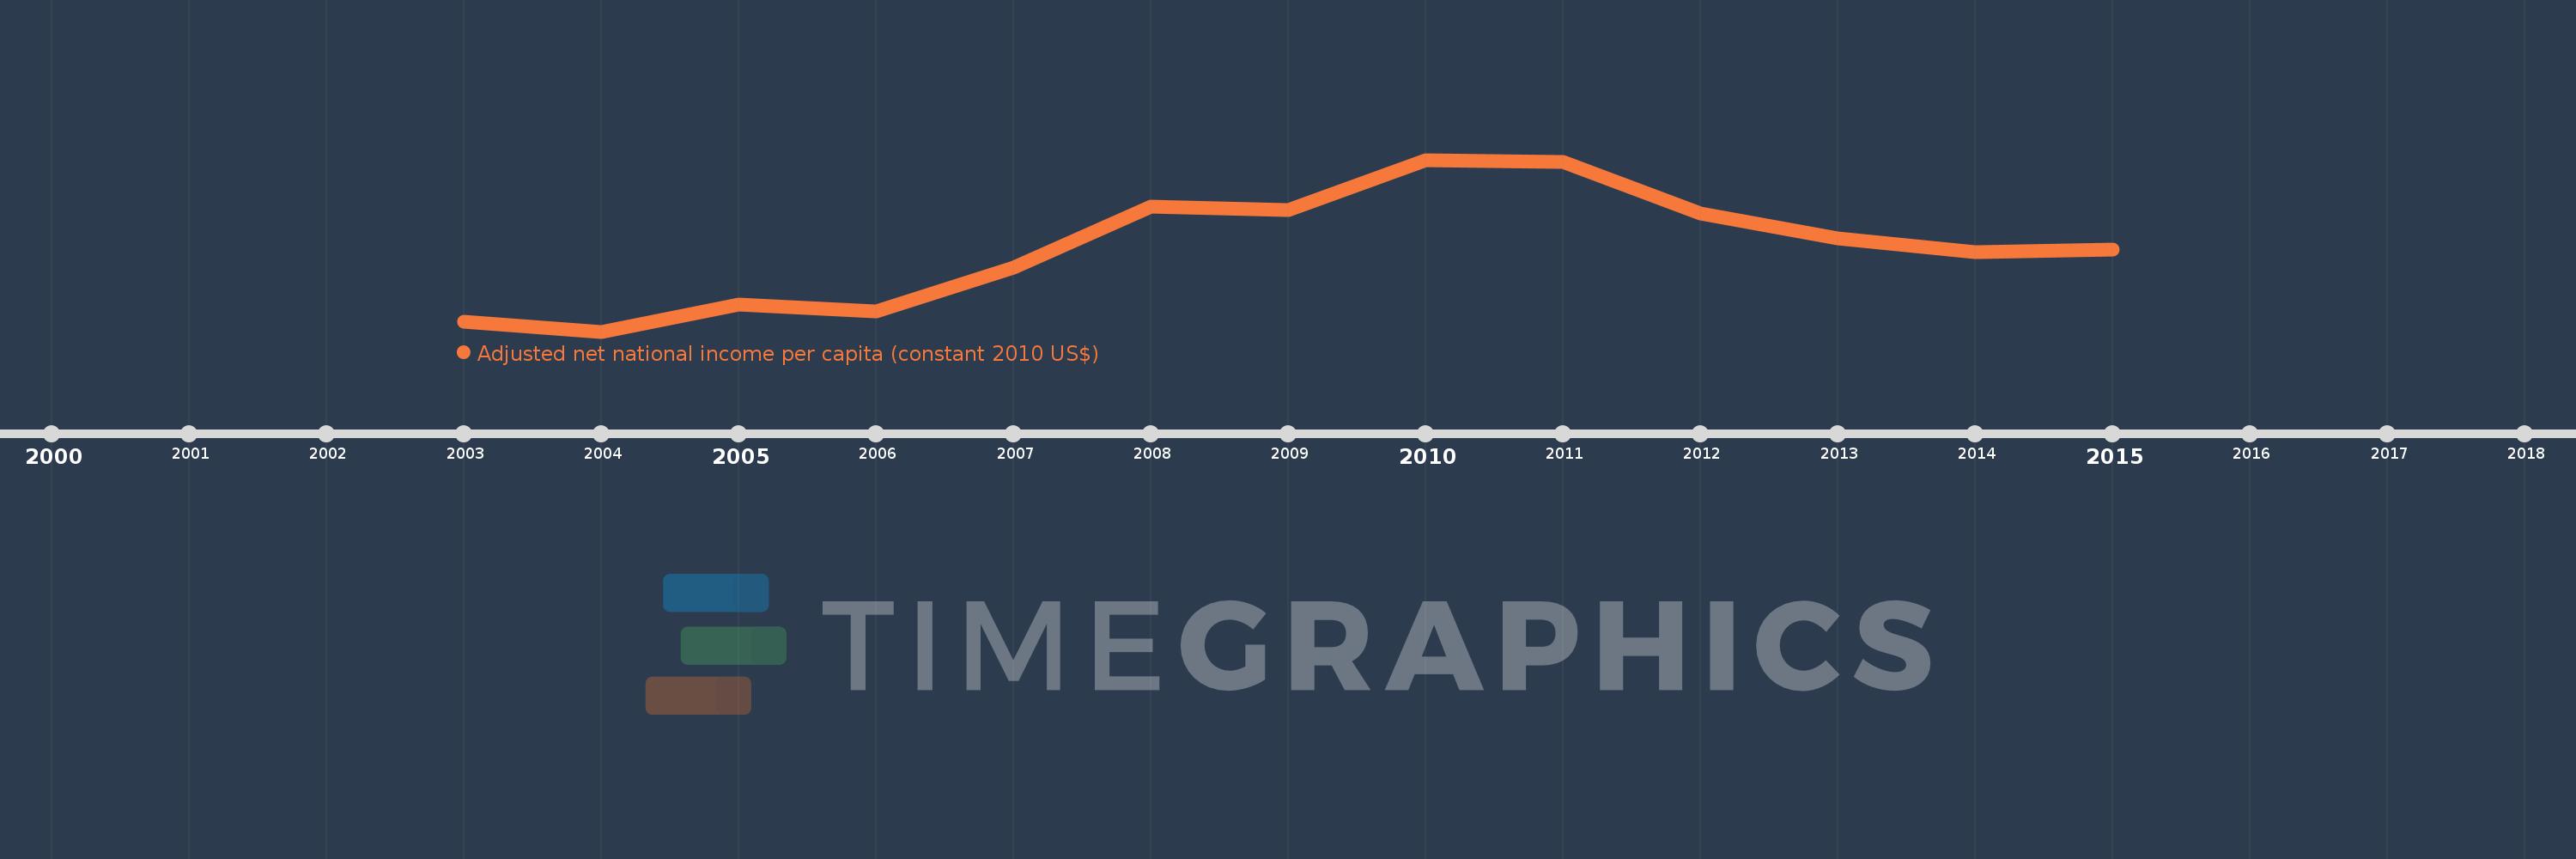
This timeline shows a graph from 2003 to 2015 of Malawi. No data until 2002. Number of actual observations by date: 13.
Source name:
World Development Indicators
Source organization:
NULWorld Bank staff estimates based on sources and methods in World Bank's "The Changing Wealth of Nations: Measuring Sustainable Development in the New Millennium" (2011).L
Categories, topics:
Economy & Growth
Last updated:
apr 23, 2017
Indicators value changes by year
Meaning:
272.302
Minimum:
221.675
jan 1, 2004
Maximum:
326.123
jan 1, 2010
At the date of observation
Value
Absolute change
Change from the previous value
jan 1, 2003
227.474
+227.474
0.0%
jan 1, 2004
221.675
-5.799
-2.55%
jan 1, 2005
238.067
+16.392
7.39%
jan 1, 2006
234.064
-4.003
-1.68%
jan 1, 2007
260.797
+26.733
11.42%
jan 1, 2008
297.858
+37.061
14.21%
jan 1, 2009
295.449
-2.409
-0.81%
jan 1, 2010
326.123
+30.674
10.38%
jan 1, 2011
324.958
-1.165
-0.36%
jan 1, 2012
293.344
-31.615
-9.73%
jan 1, 2013
278.401
-14.942
-5.09%
jan 1, 2014
270.156
-8.245
-2.96%
jan 1, 2015
271.553
+1.397
0.52%
Ranking of countries by current statistics by years