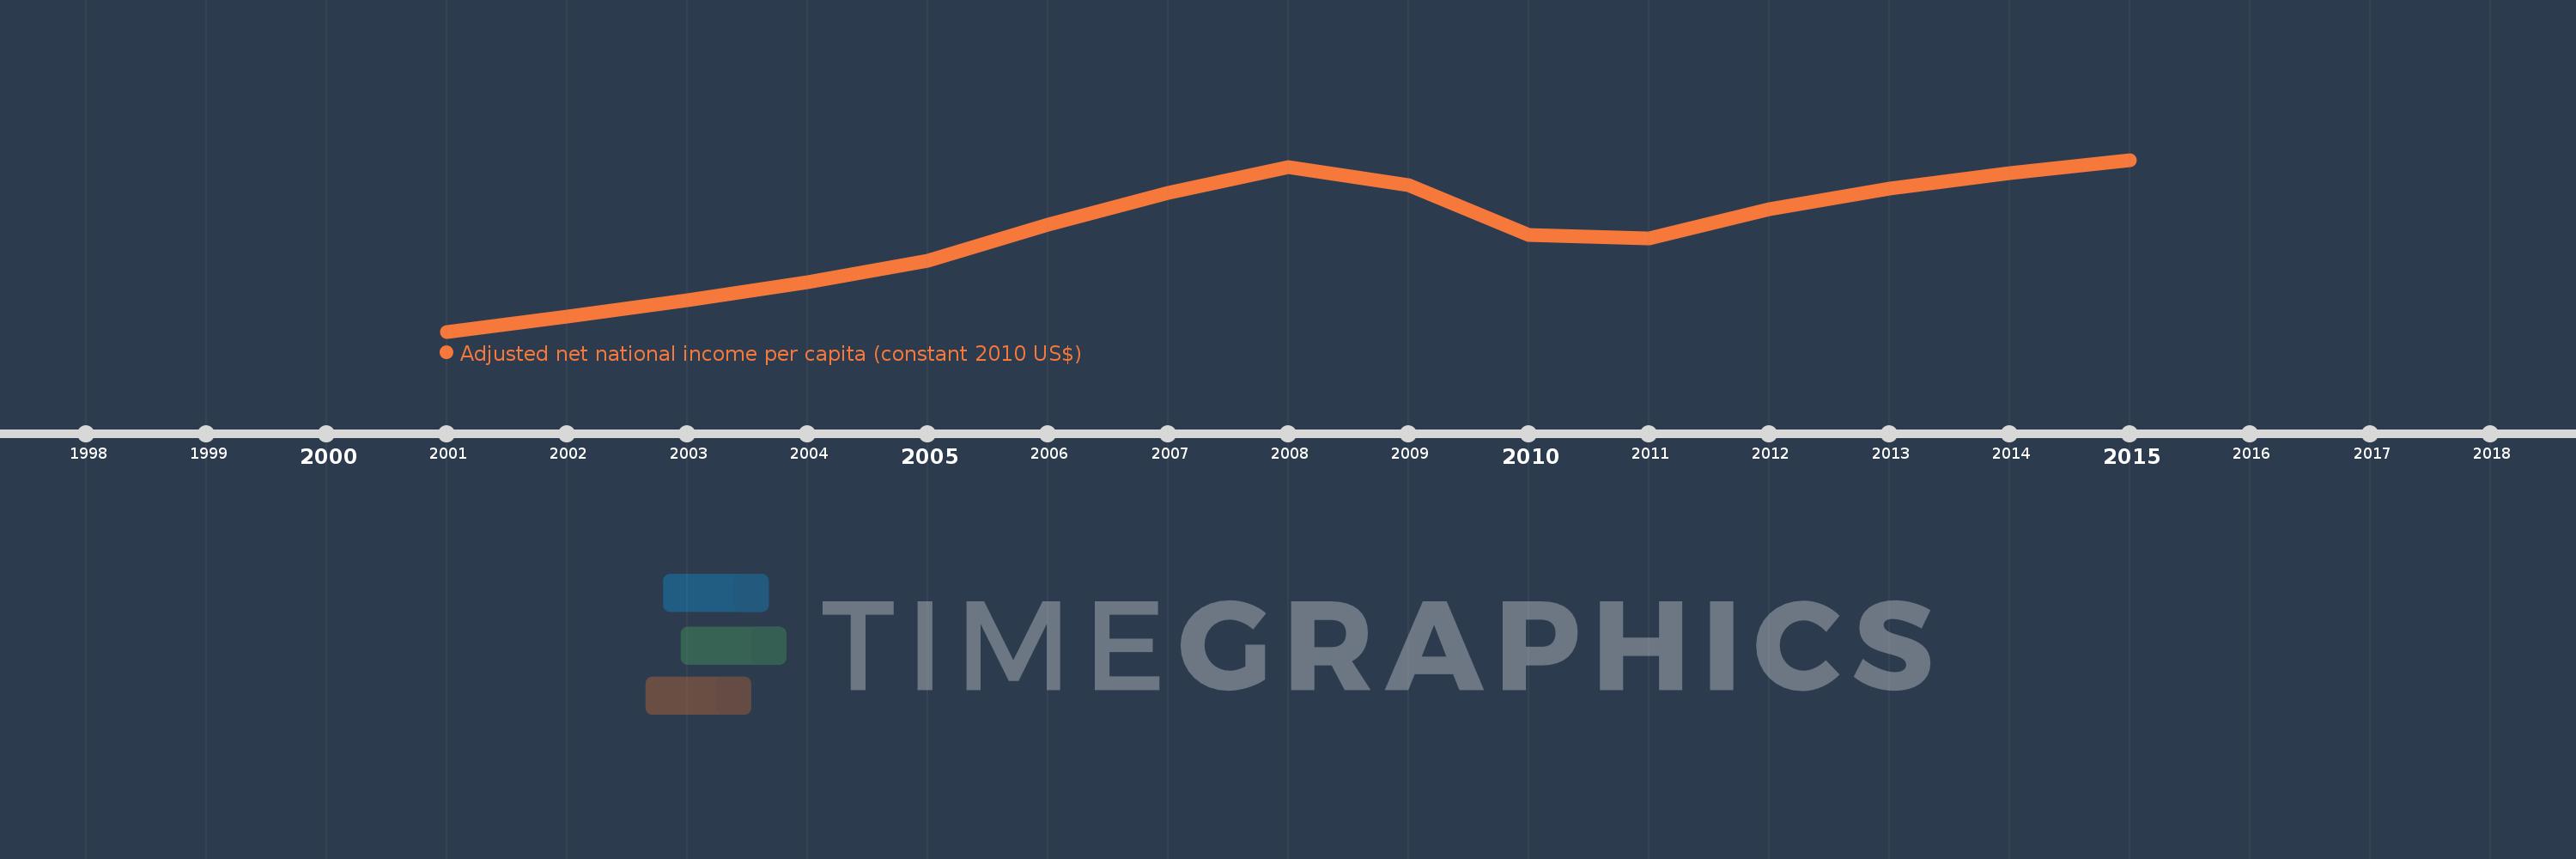
This timeline shows a graph from 2001 to 2015 of Estonia. No data until 2000. Number of actual observations by date: 15.
Source name:
World Development Indicators
Source organization:
NULWorld Bank staff estimates based on sources and methods in World Bank's "The Changing Wealth of Nations: Measuring Sustainable Development in the New Millennium" (2011).L
Categories, topics:
Economy & Growth
Last updated:
apr 23, 2017
Indicators value changes by year
Meaning:
11.691K
Minimum:
7.653K
jan 1, 2001
Maximum:
14.554K
jan 1, 2015
At the date of observation
Value
Absolute change
Change from the previous value
jan 1, 2001
7.653K
+7.653K
0.0%
jan 1, 2002
8.265K
+612.166
8.0%
jan 1, 2003
8.915K
+649.703
7.86%
jan 1, 2004
9.633K
+717.985
8.05%
jan 1, 2005
10.494K
+860.903
8.94%
jan 1, 2006
11.946K
+1.452K
13.84%
jan 1, 2007
13.226K
+1.28K
10.72%
jan 1, 2008
14.249K
+1.023K
7.73%
jan 1, 2009
13.529K
-720.365
-5.06%
jan 1, 2010
11.536K
-1.993K
-14.73%
jan 1, 2011
11.384K
-151.722
-1.32%
jan 1, 2012
12.566K
+1.182K
10.38%
jan 1, 2013
13.384K
+818.477
6.51%
jan 1, 2014
14.031K
+646.658
4.83%
jan 1, 2015
14.554K
+522.87
3.73%
Ranking of countries by current statistics by years