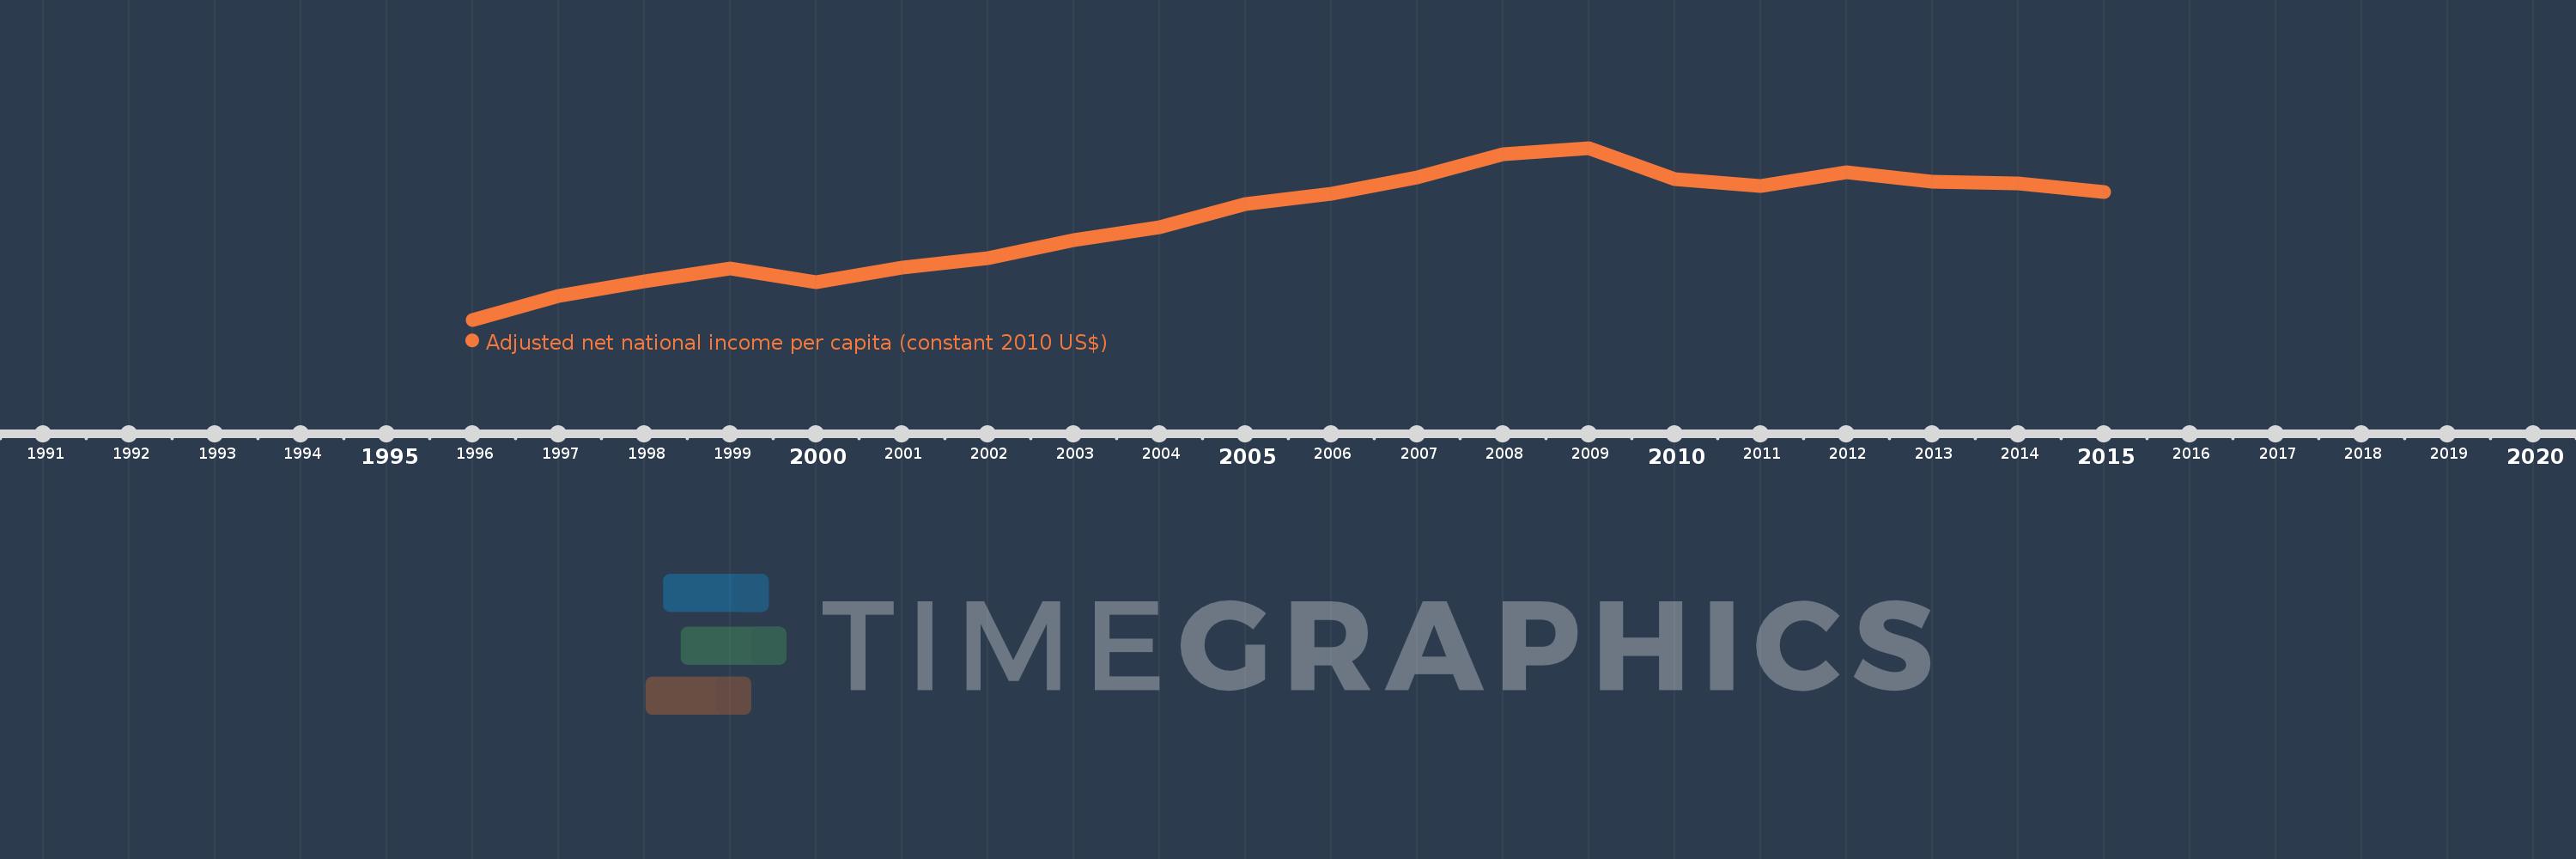
This timeline shows a graph from 1996 to 2015 of Croatia. No data until 1995. Number of actual observations by date: 20.
Source name:
World Development Indicators
Source organization:
NULWorld Bank staff estimates based on sources and methods in World Bank's "The Changing Wealth of Nations: Measuring Sustainable Development in the New Millennium" (2011).L
Categories, topics:
Economy & Growth
Last updated:
apr 23, 2017
Indicators value changes by year
Meaning:
9.61K
Minimum:
6.624K
jan 1, 1996
Maximum:
11.804K
jan 1, 2009
At the date of observation
Value
Absolute change
Change from the previous value
jan 1, 1996
6.624K
+6.624K
0.0%
jan 1, 1997
7.336K
+711.993
10.75%
jan 1, 1998
7.791K
+454.395
6.19%
jan 1, 1999
8.165K
+374.581
4.81%
jan 1, 2000
7.745K
-419.765
-5.14%
jan 1, 2001
8.19K
+444.384
5.74%
jan 1, 2002
8.469K
+279.039
3.41%
jan 1, 2003
9.016K
+546.87
6.46%
jan 1, 2004
9.425K
+409.605
4.54%
jan 1, 2005
10.114K
+688.98
7.31%
jan 1, 2006
10.412K
+298.041
2.95%
jan 1, 2007
10.909K
+497.018
4.77%
jan 1, 2008
11.605K
+695.826
6.38%
jan 1, 2009
11.804K
+198.768
1.71%
jan 1, 2010
10.855K
-949.033
-8.04%
jan 1, 2011
10.661K
-194.135
-1.79%
jan 1, 2012
11.07K
+409.389
3.84%
jan 1, 2013
10.787K
-282.847
-2.56%
jan 1, 2014
10.734K
-53.834
-0.5%
jan 1, 2015
10.477K
-256.41
-2.39%
Ranking of countries by current statistics by years