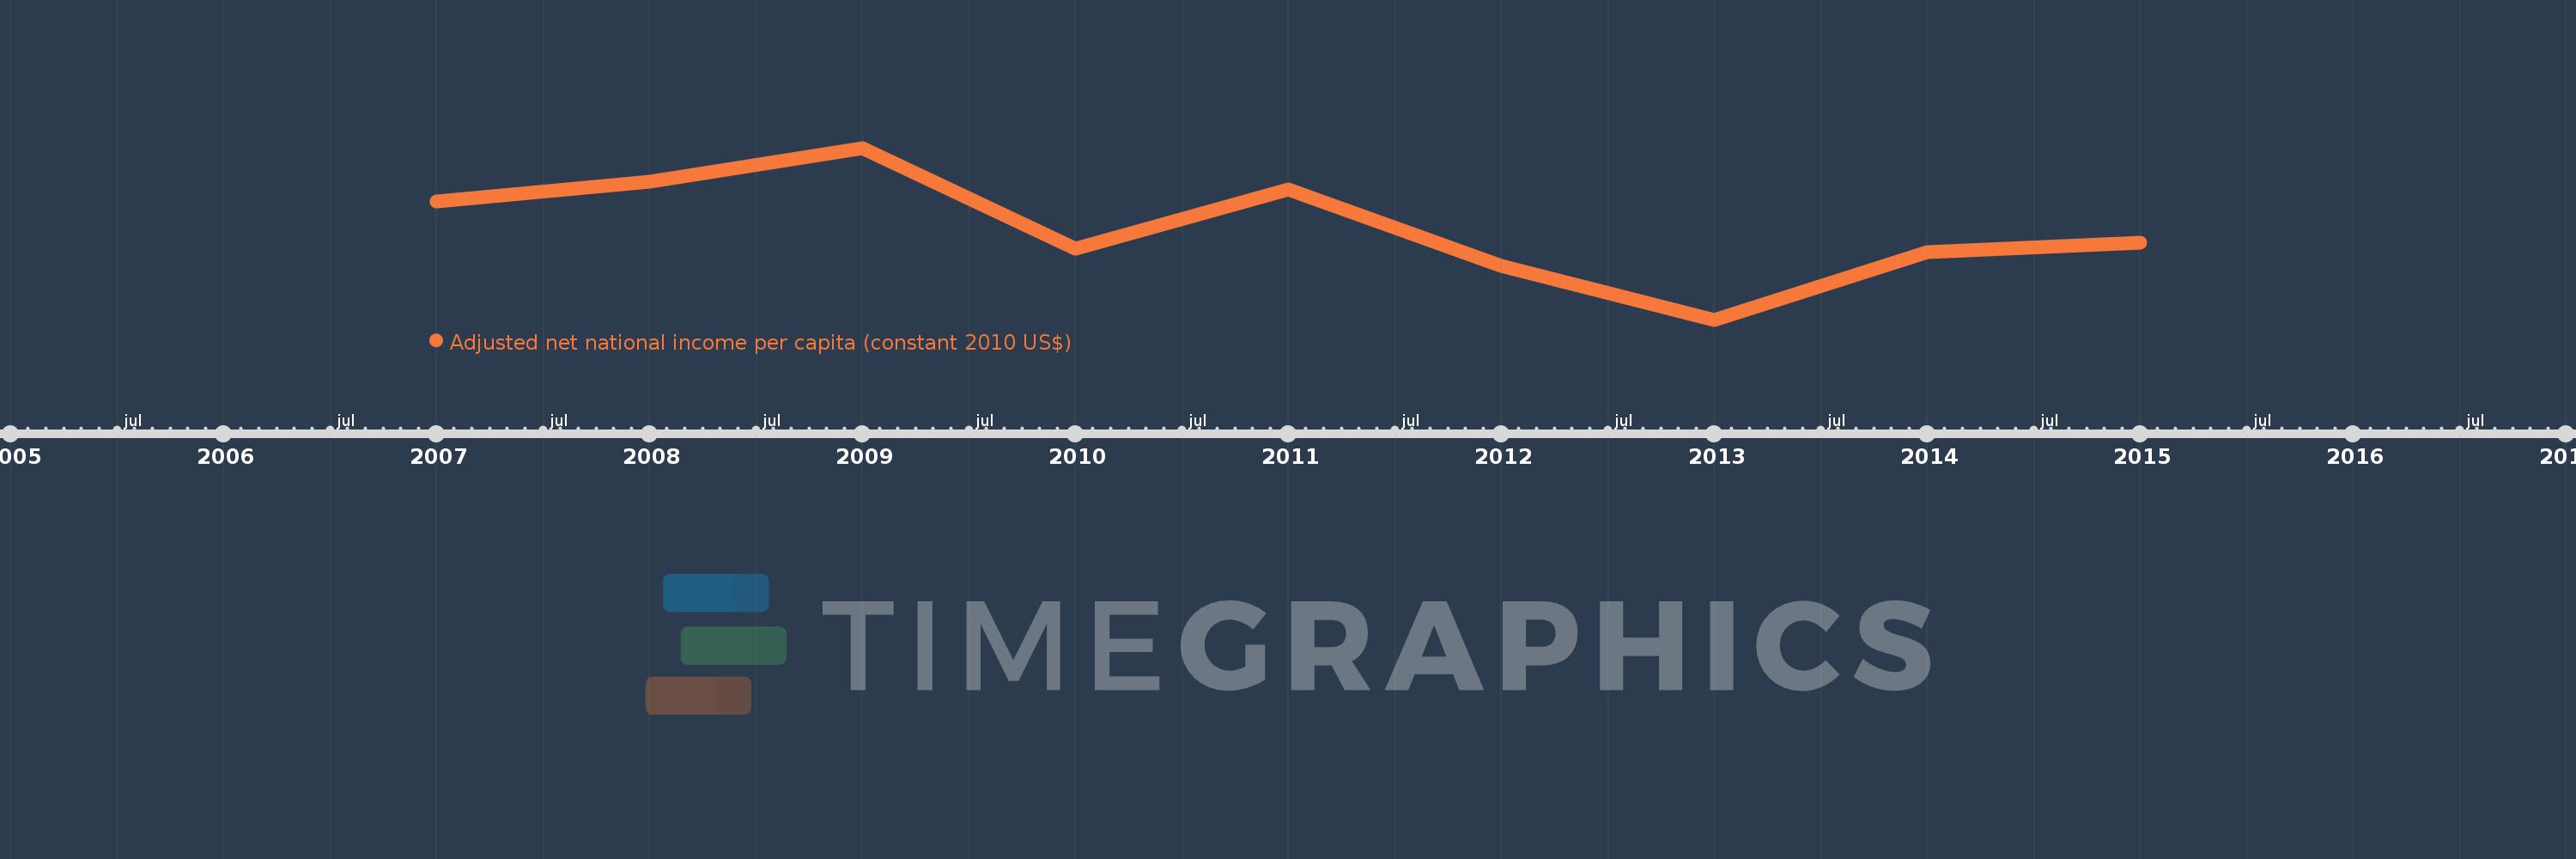
This timeline shows a graph from 2007 to 2015 of Guinea. No data until 2006. Number of actual observations by date: 9.
Source name:
World Development Indicators
Source organization:
NULWorld Bank staff estimates based on sources and methods in World Bank's "The Changing Wealth of Nations: Measuring Sustainable Development in the New Millennium" (2011).L
Categories, topics:
Economy & Growth
Last updated:
apr 23, 2017
Indicators value changes by year
Meaning:
261.131
Minimum:
228.792
jan 1, 2013
Maximum:
289.113
jan 1, 2009
At the date of observation
Value
Absolute change
Change from the previous value
jan 1, 2007
270.302
+270.302
0.0%
jan 1, 2008
277.237
+6.936
2.57%
jan 1, 2009
289.113
+11.876
4.28%
jan 1, 2010
253.877
-35.236
-12.19%
jan 1, 2011
274.653
+20.775
8.18%
jan 1, 2012
247.689
-26.963
-9.82%
jan 1, 2013
228.792
-18.897
-7.63%
jan 1, 2014
252.517
+23.724
10.37%
jan 1, 2015
255.996
+3.479
1.38%
Ranking of countries by current statistics by years