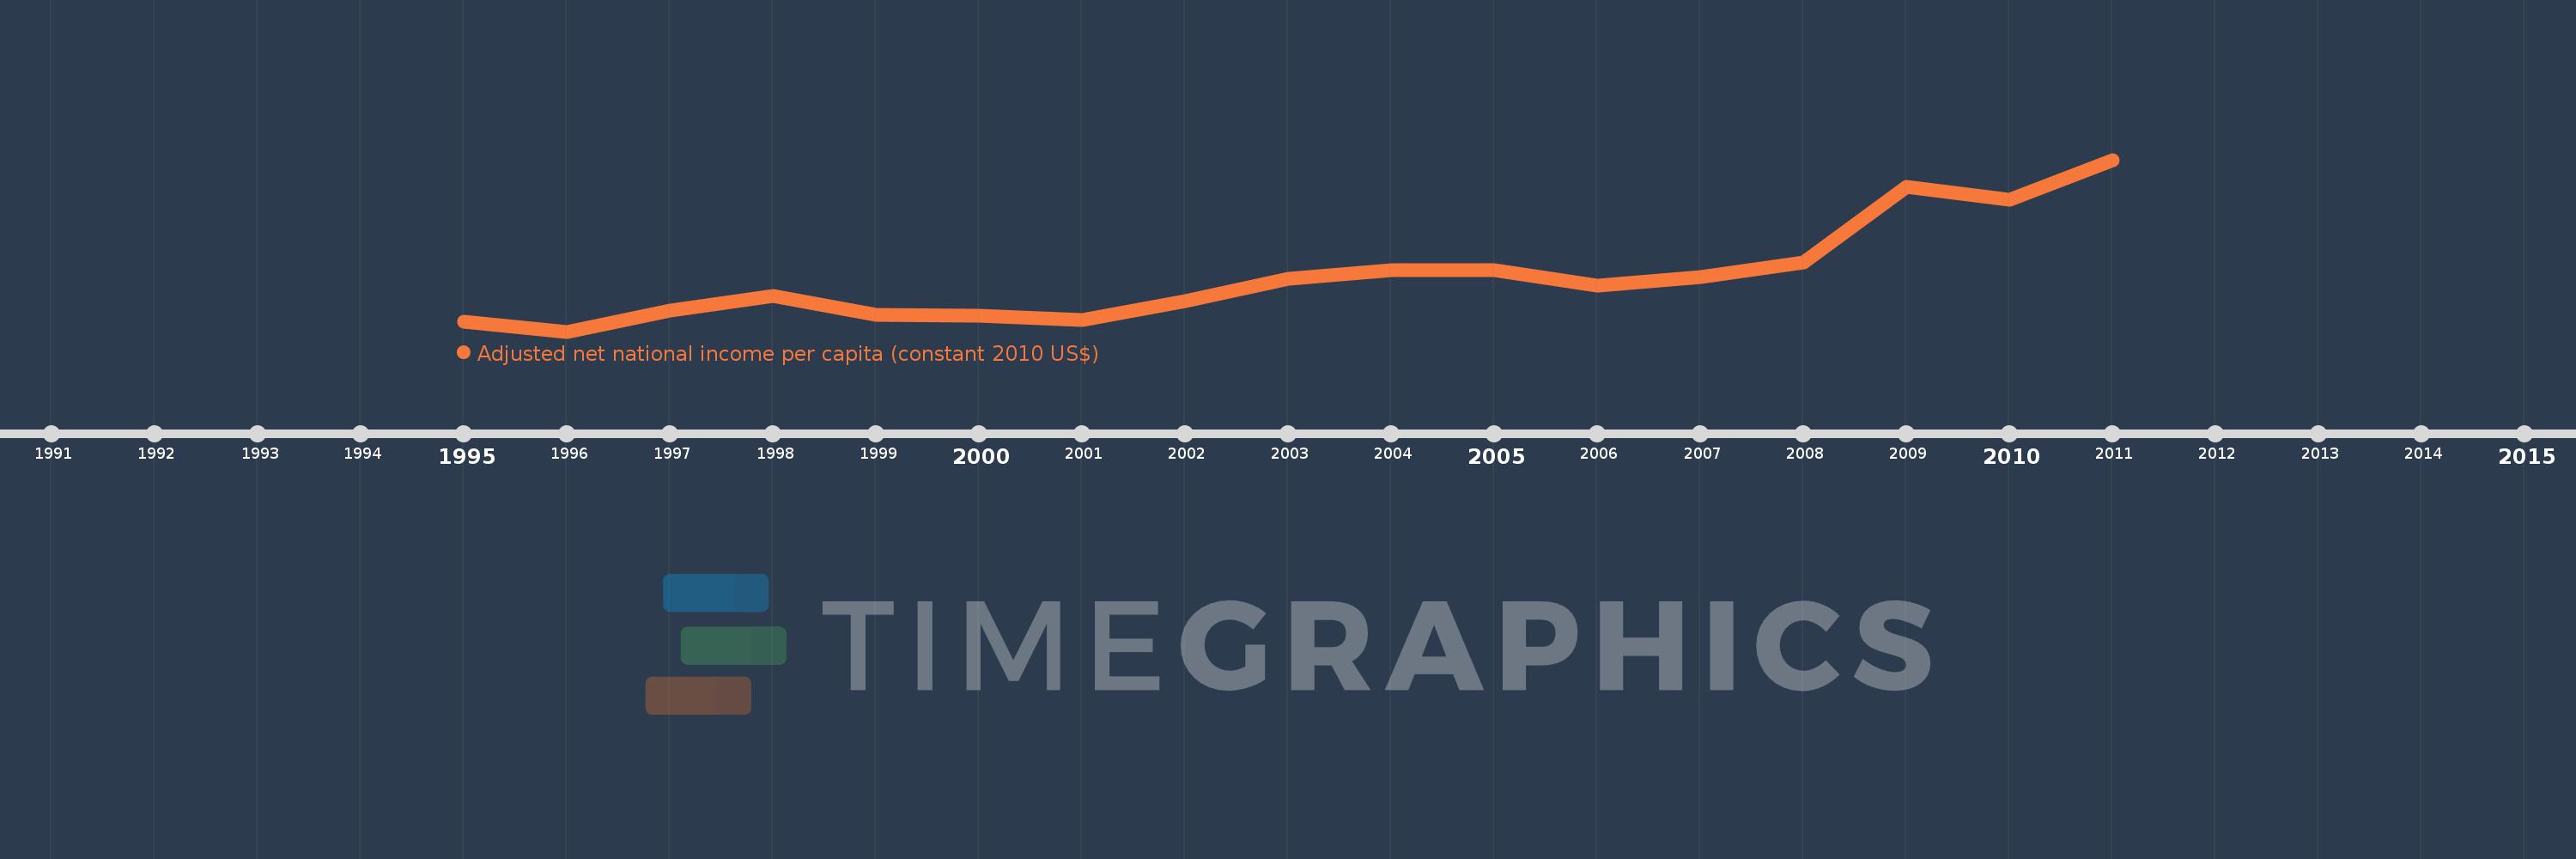
This timeline shows a graph from 1995 to 2011 of Zambia. No data until 1994. Number of actual observations by date: 17.
Source name:
World Development Indicators
Source organization:
NULWorld Bank staff estimates based on sources and methods in World Bank's "The Changing Wealth of Nations: Measuring Sustainable Development in the New Millennium" (2011).L
Categories, topics:
Economy & Growth
Last updated:
apr 23, 2017
Indicators value changes by year
Meaning:
745.403
Minimum:
650.673
jan 1, 1996
Maximum:
946.912
jan 1, 2011
At the date of observation
Value
Absolute change
Change from the previous value
jan 1, 1995
667.348
+667.348
0.0%
jan 1, 1996
650.673
-16.675
-2.5%
jan 1, 1997
686.487
+35.814
5.5%
jan 1, 1998
711.451
+24.964
3.64%
jan 1, 1999
680.183
-31.268
-4.39%
jan 1, 2000
677.393
-2.79
-0.41%
jan 1, 2001
671.398
-5.995
-0.89%
jan 1, 2002
703.845
+32.448
4.83%
jan 1, 2003
741.449
+37.604
5.34%
jan 1, 2004
756.106
+14.657
1.98%
jan 1, 2005
756.053
-0.054
-0.01%
jan 1, 2006
729.58
-26.472
-3.5%
jan 1, 2007
744.677
+15.097
2.07%
jan 1, 2008
769.336
+24.659
3.31%
jan 1, 2009
900.472
+131.136
17.05%
jan 1, 2010
878.489
-21.983
-2.44%
jan 1, 2011
946.912
+68.423
7.79%
Ranking of countries by current statistics by years