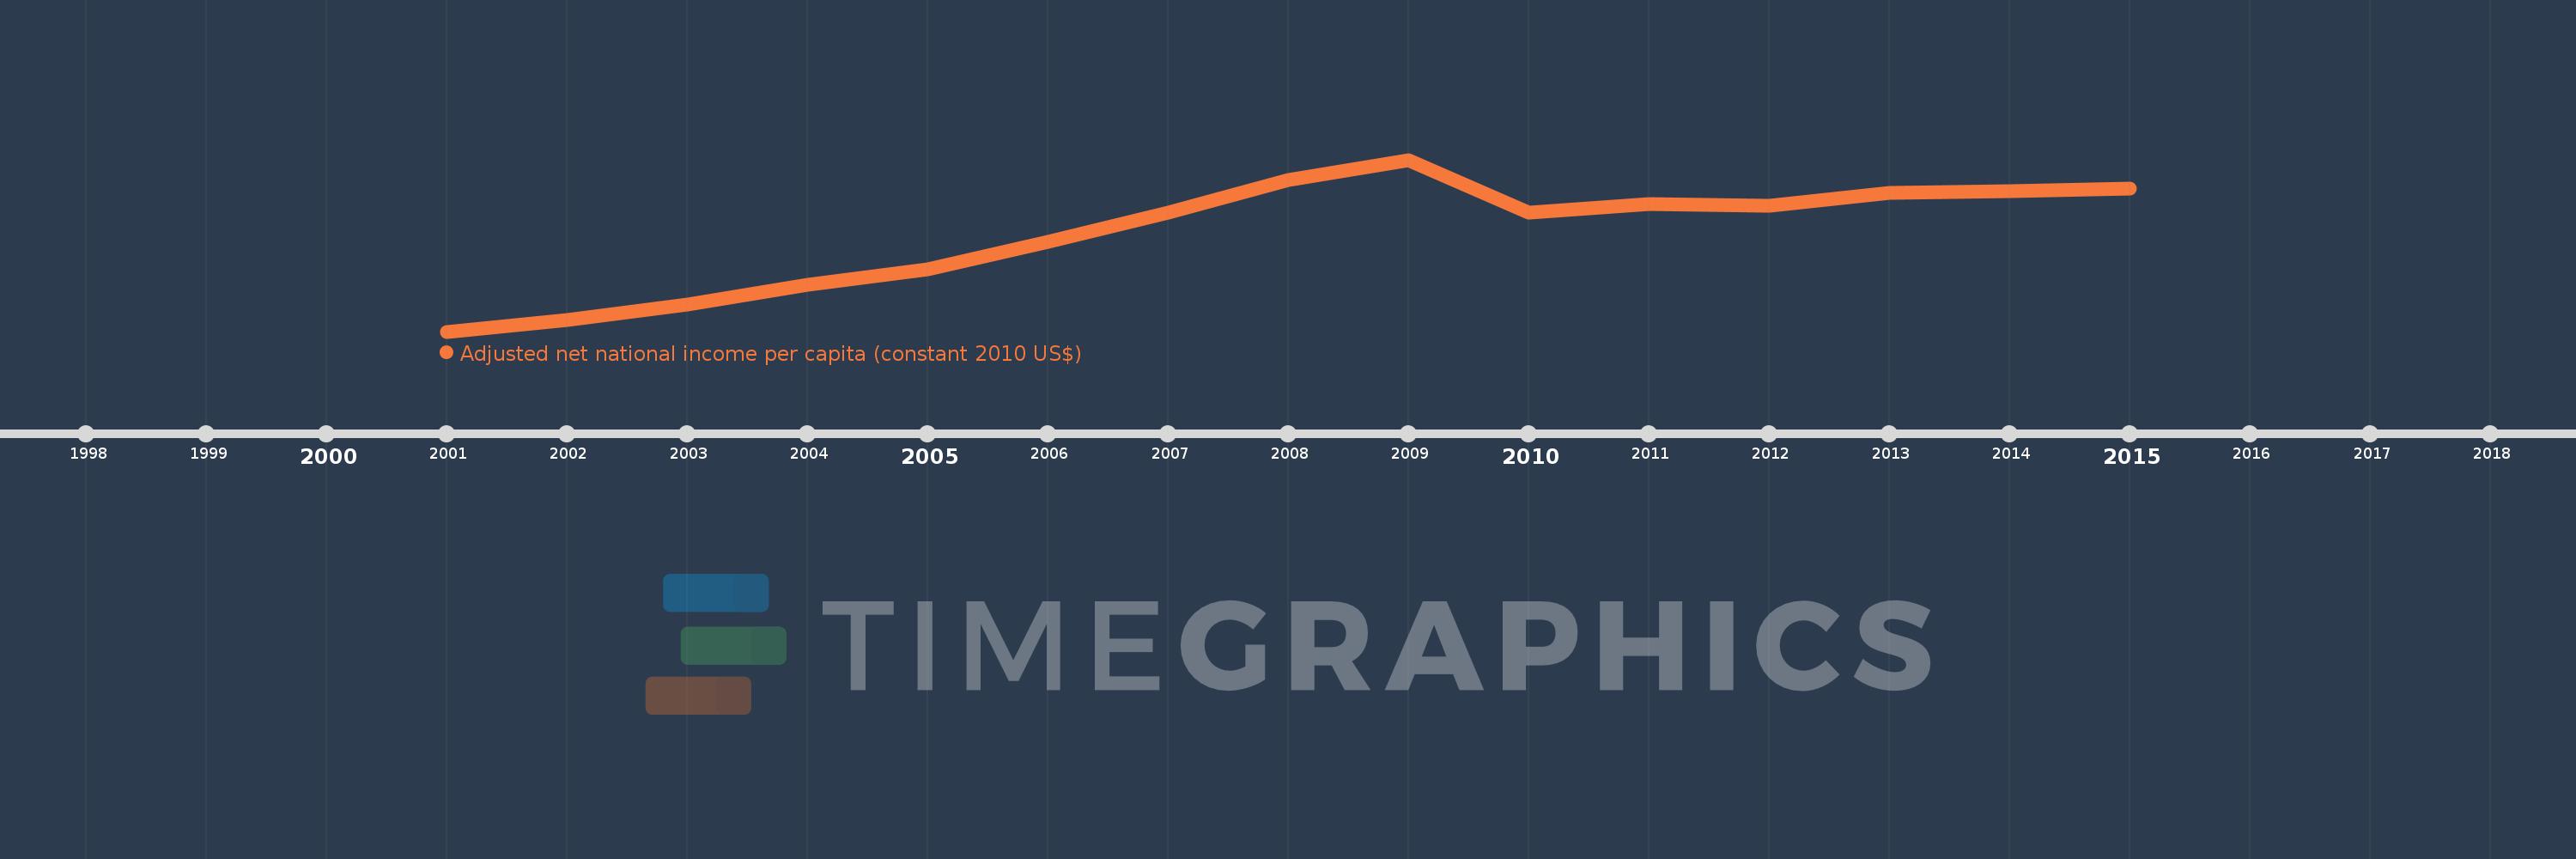
This timeline shows a graph from 2001 to 2015 of Armenia. No data until 2000. Number of actual observations by date: 15.
Source name:
World Development Indicators
Source organization:
NULWorld Bank staff estimates based on sources and methods in World Bank's "The Changing Wealth of Nations: Measuring Sustainable Development in the New Millennium" (2011).L
Categories, topics:
Economy & Growth
Last updated:
apr 23, 2017
Indicators value changes by year
Meaning:
2.493K
Minimum:
1.242K
jan 1, 2001
Maximum:
3.427K
jan 1, 2009
At the date of observation
Value
Absolute change
Change from the previous value
jan 1, 2001
1.242K
+1.242K
0.0%
jan 1, 2002
1.391K
+149.273
12.02%
jan 1, 2003
1.587K
+195.491
14.05%
jan 1, 2004
1.838K
+251.331
15.84%
jan 1, 2005
2.033K
+194.472
10.58%
jan 1, 2006
2.385K
+352.594
17.35%
jan 1, 2007
2.75K
+364.795
15.29%
jan 1, 2008
3.175K
+425.054
15.46%
jan 1, 2009
3.427K
+251.802
7.93%
jan 1, 2010
2.752K
-674.517
-19.68%
jan 1, 2011
2.868K
+116.035
4.22%
jan 1, 2012
2.846K
-21.93
-0.76%
jan 1, 2013
3.008K
+161.149
5.66%
jan 1, 2014
3.024K
+16.879
0.56%
jan 1, 2015
3.065K
+41.006
1.36%
Ranking of countries by current statistics by years