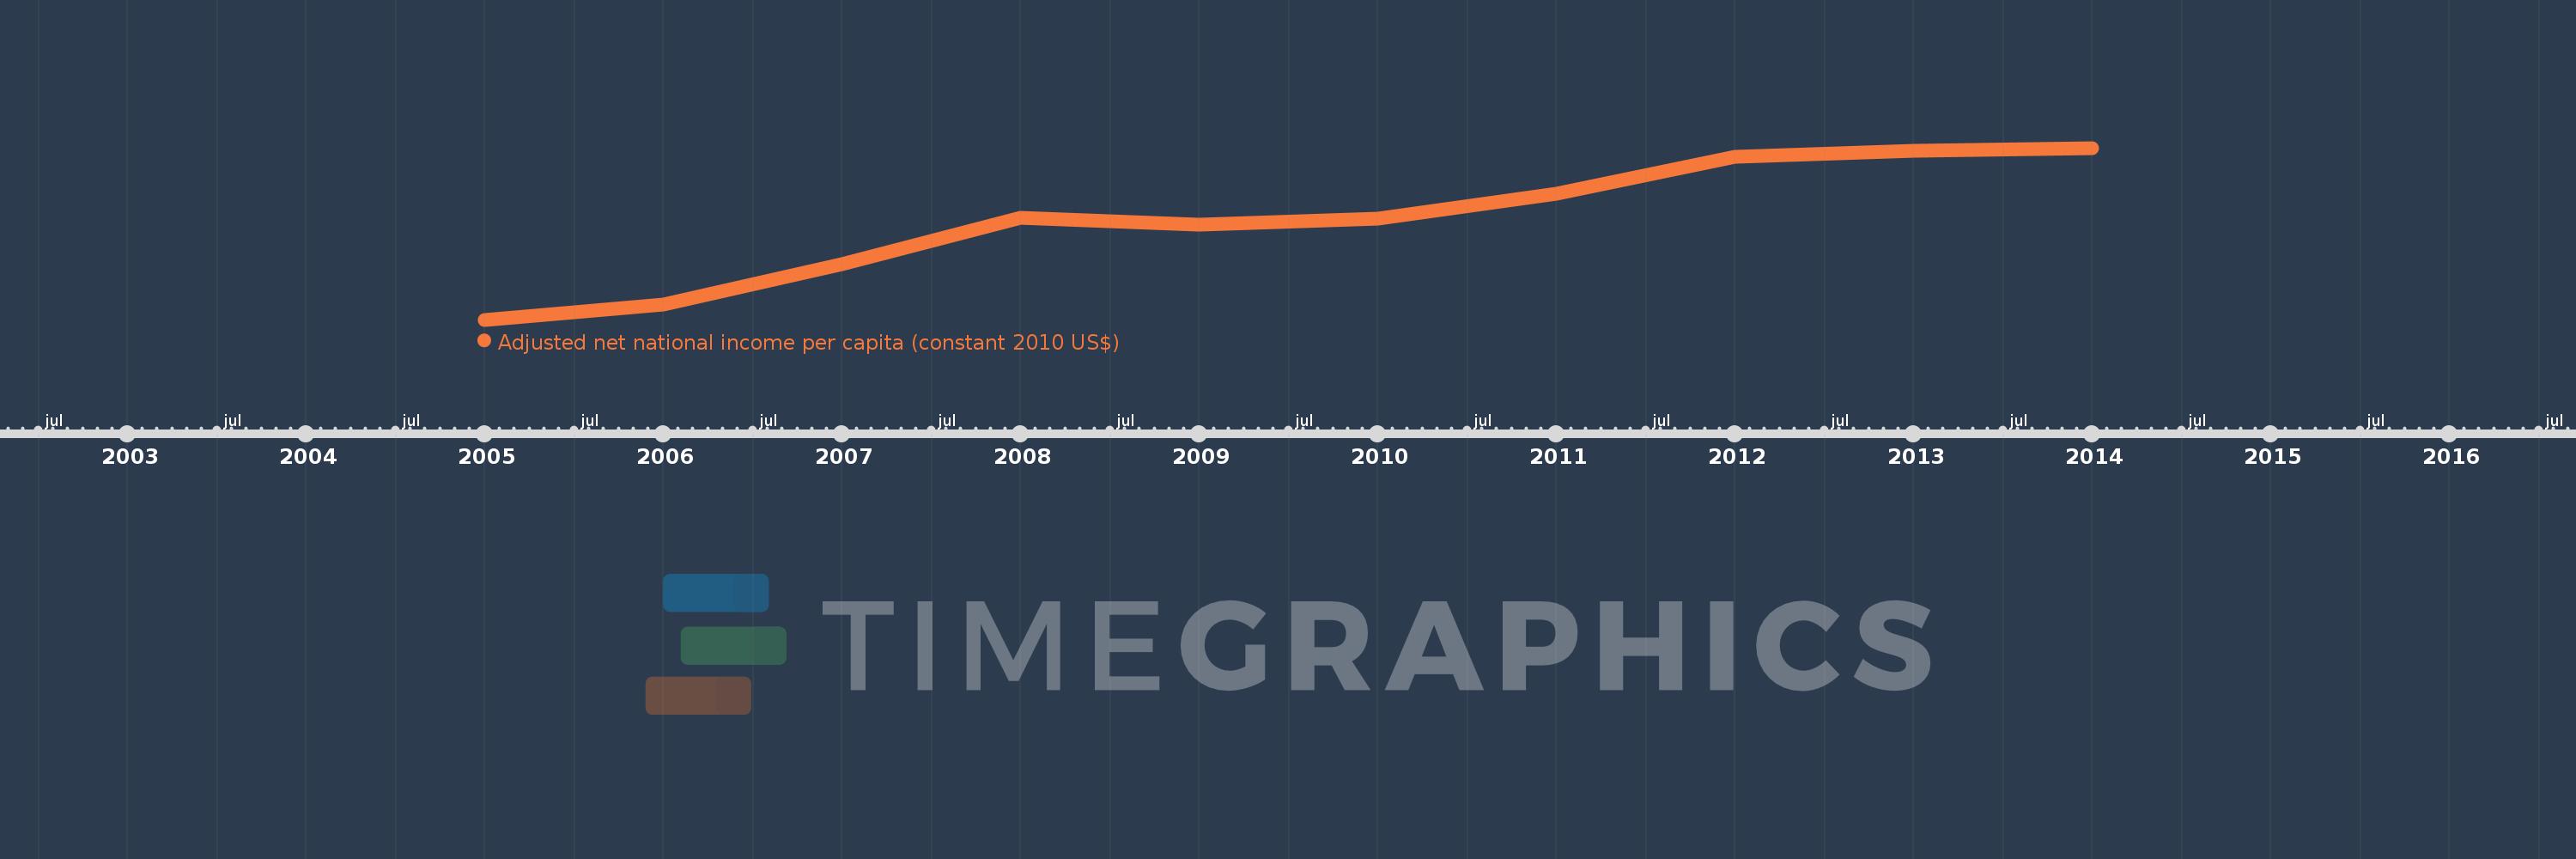
This timeline shows a graph from 2005 to 2014 of Middle East & North Africa. No data until 2004. Number of actual observations by date: 10.
Source name:
World Development Indicators
Source organization:
NULWorld Bank staff estimates based on sources and methods in World Bank's "The Changing Wealth of Nations: Measuring Sustainable Development in the New Millennium" (2011).L
Categories, topics:
Economy & Growth
Last updated:
apr 23, 2017
Indicators value changes by year
Meaning:
5.089K
Minimum:
4.228K
jan 1, 2005
Maximum:
5.708K
jan 1, 2014
At the date of observation
Value
Absolute change
Change from the previous value
jan 1, 2005
4.228K
+4.228K
0.0%
jan 1, 2006
4.359K
+130.275
3.08%
jan 1, 2007
4.704K
+345.27
7.92%
jan 1, 2008
5.109K
+404.825
8.61%
jan 1, 2009
5.048K
-60.68
-1.19%
jan 1, 2010
5.101K
+52.806
1.05%
jan 1, 2011
5.315K
+214.028
4.2%
jan 1, 2012
5.633K
+317.737
5.98%
jan 1, 2013
5.685K
+52.564
0.93%
jan 1, 2014
5.708K
+22.883
0.4%
Ranking of countries by current statistics by years