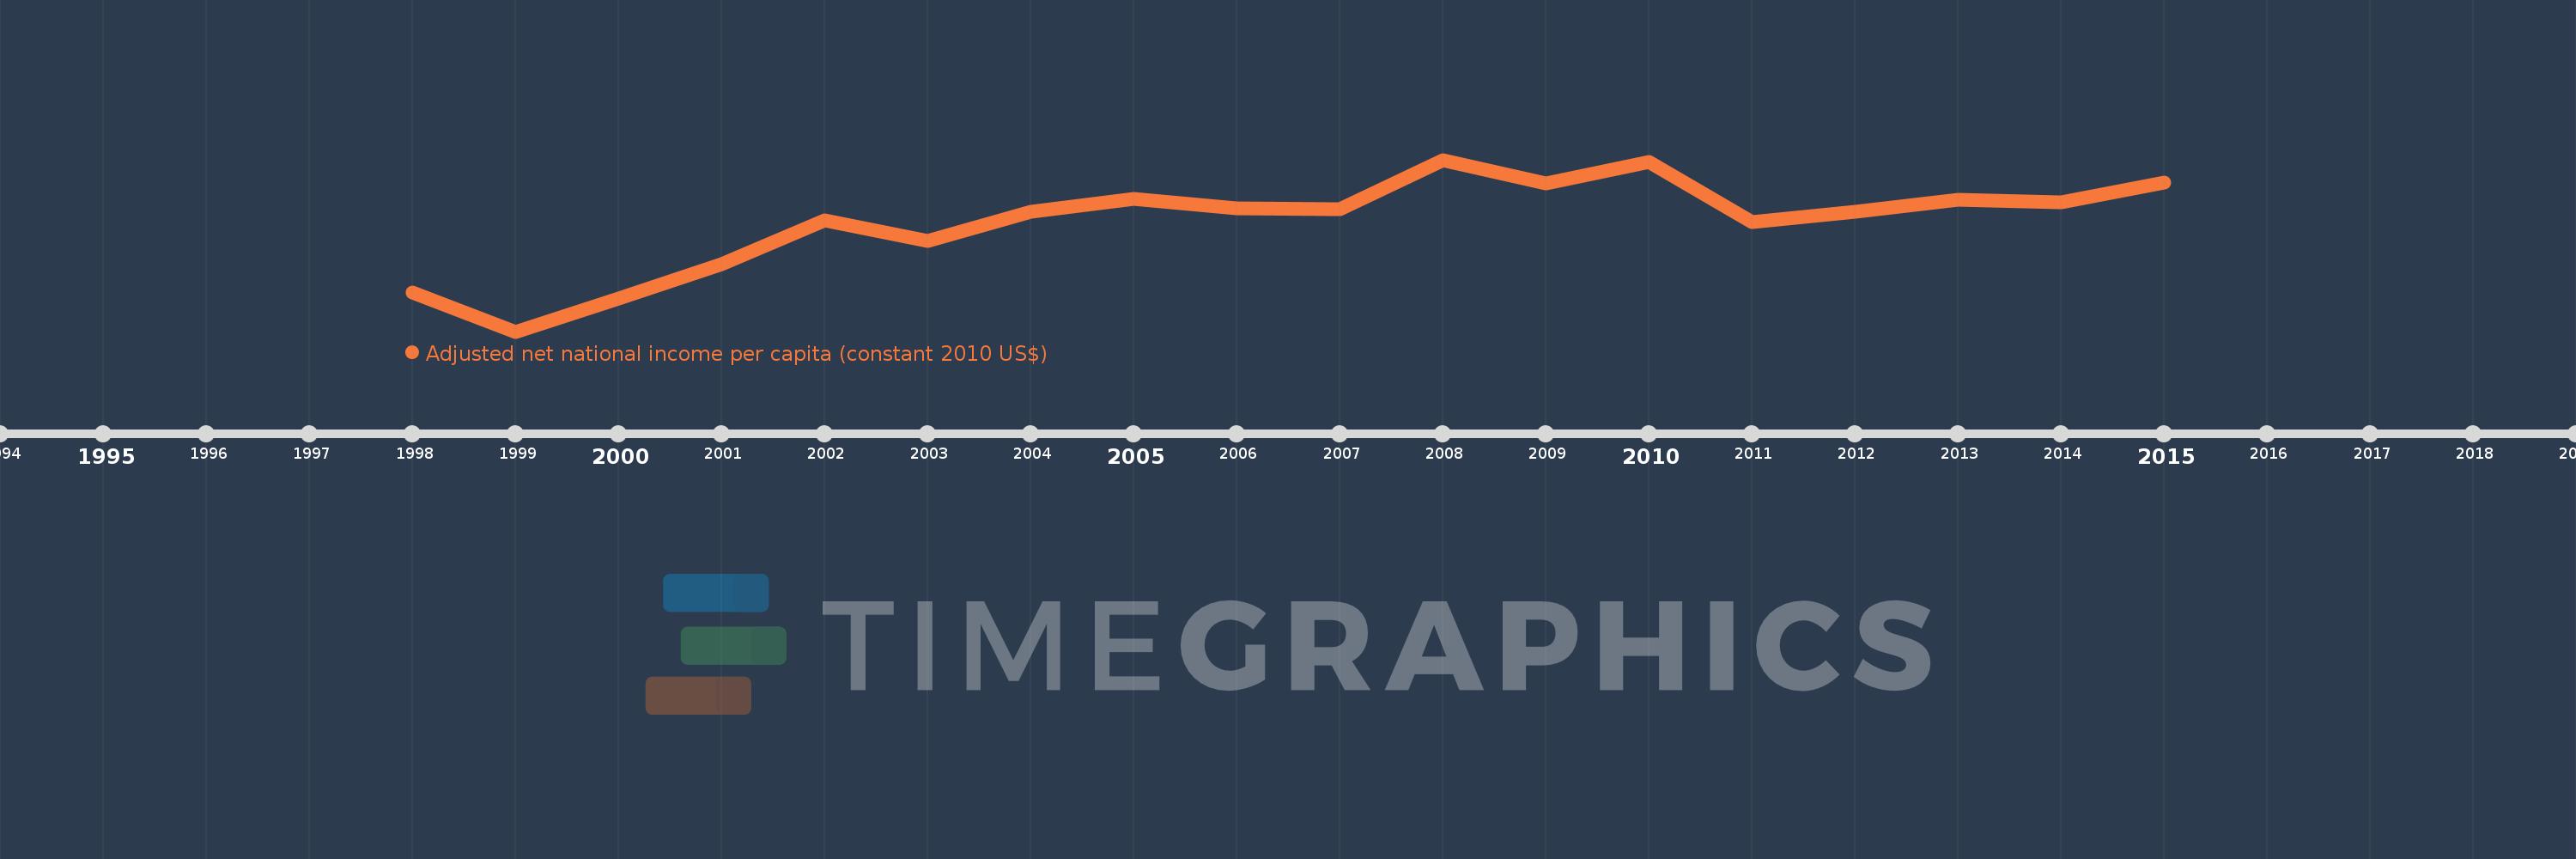
This timeline shows a graph from 1998 to 2015 of Kyrgyz Republic. No data until 1997. Number of actual observations by date: 18.
Source name:
World Development Indicators
Source organization:
NULWorld Bank staff estimates based on sources and methods in World Bank's "The Changing Wealth of Nations: Measuring Sustainable Development in the New Millennium" (2011).L
Categories, topics:
Economy & Growth
Last updated:
apr 23, 2017
Indicators value changes by year
Meaning:
659.225
Minimum:
493.436
jan 1, 1999
Maximum:
753.88
jan 1, 2008
At the date of observation
Value
Absolute change
Change from the previous value
jan 1, 1998
552.617
+552.617
0.0%
jan 1, 1999
493.436
-59.182
-10.71%
jan 1, 2000
543.821
+50.385
10.21%
jan 1, 2001
595.013
+51.192
9.41%
jan 1, 2002
662.545
+67.532
11.35%
jan 1, 2003
631.005
-31.54
-4.76%
jan 1, 2004
675.431
+44.426
7.04%
jan 1, 2005
694.749
+19.318
2.86%
jan 1, 2006
680.262
-14.487
-2.09%
jan 1, 2007
679.289
-0.973
-0.14%
jan 1, 2008
753.88
+74.591
10.98%
jan 1, 2009
718.049
-35.831
-4.75%
jan 1, 2010
750.529
+32.48
4.52%
jan 1, 2011
659.817
-90.713
-12.09%
jan 1, 2012
674.469
+14.652
2.22%
jan 1, 2013
693.311
+18.842
2.79%
jan 1, 2014
689.085
-4.225
-0.61%
jan 1, 2015
718.741
+29.656
4.3%
Ranking of countries by current statistics by years