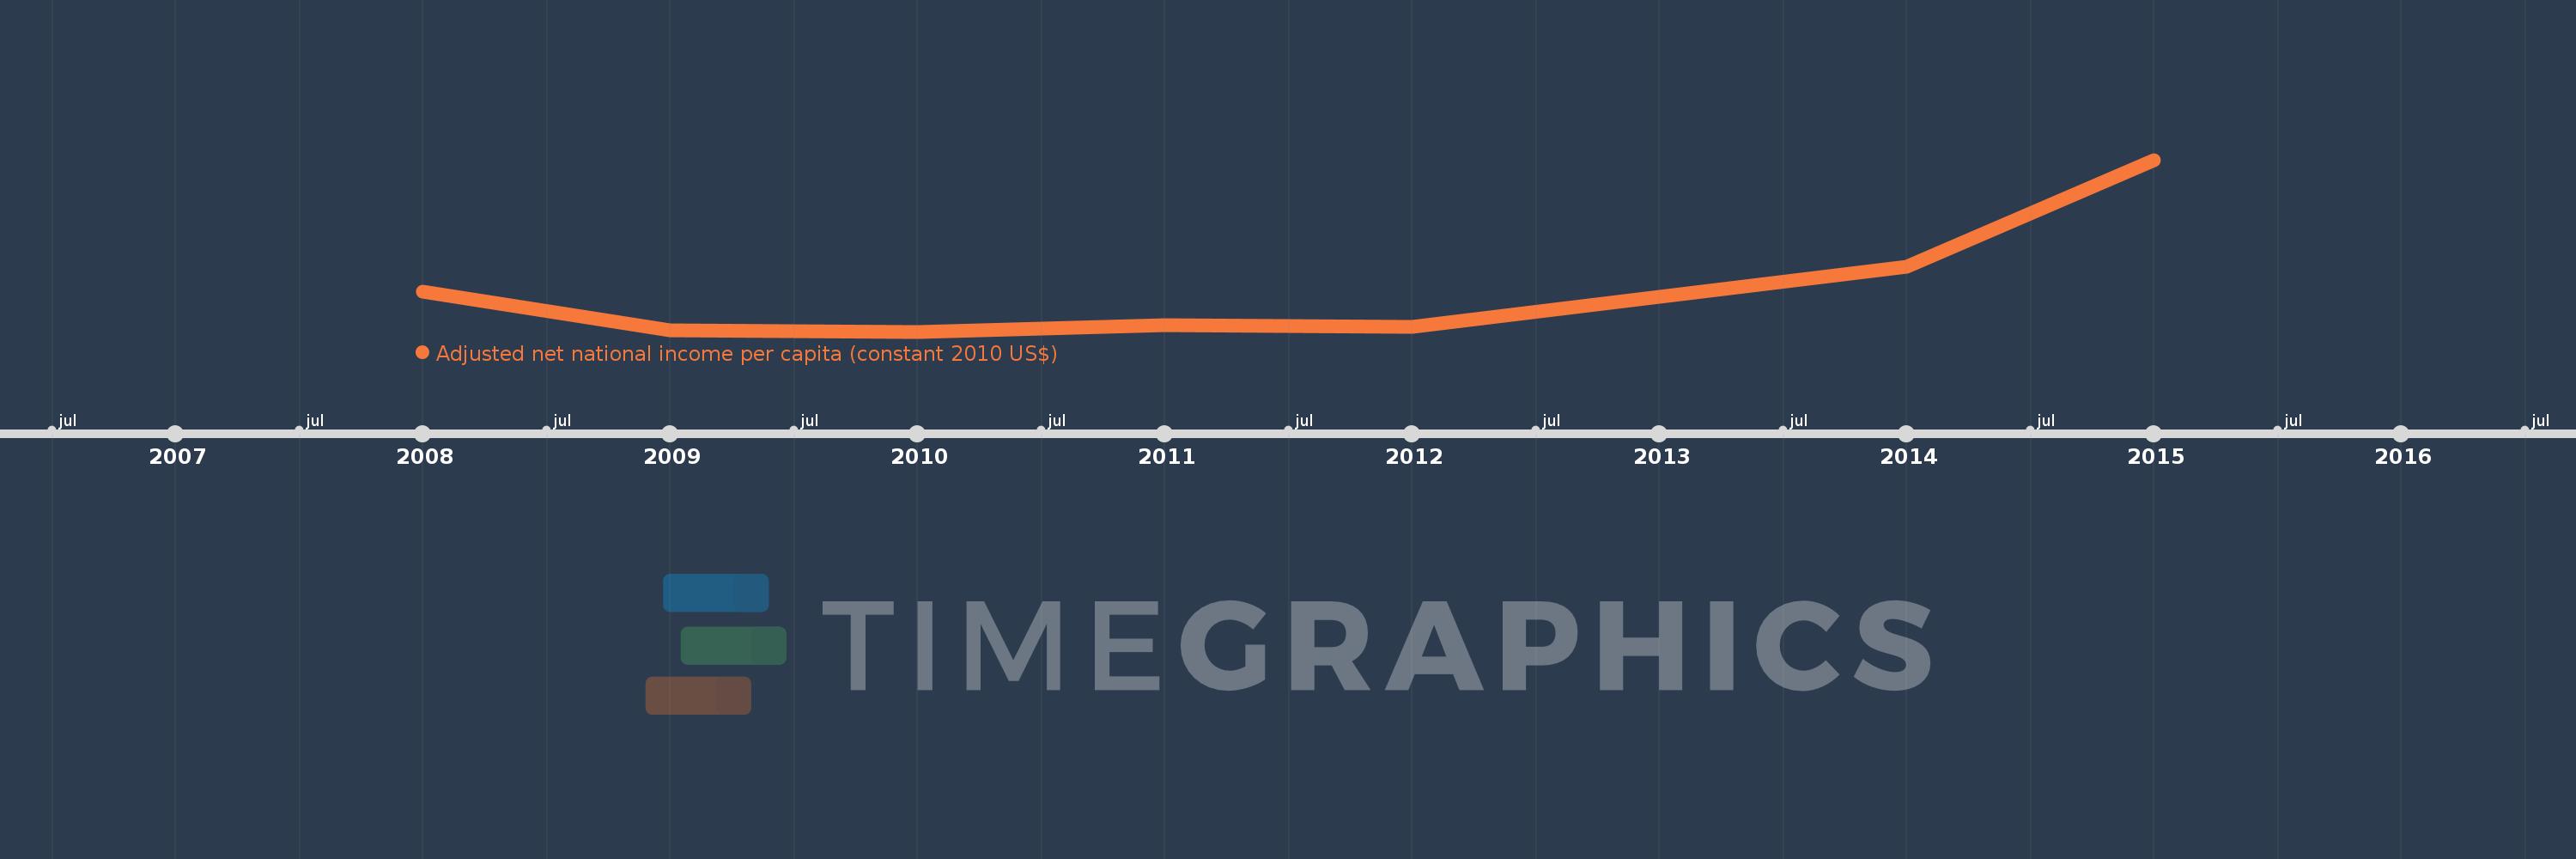
This timeline shows a graph from 2008 to 2015 of Caribbean small states. No data until 2007. Number of actual observations by date: 8.
Source name:
World Development Indicators
Source organization:
NULWorld Bank staff estimates based on sources and methods in World Bank's "The Changing Wealth of Nations: Measuring Sustainable Development in the New Millennium" (2011).L
Categories, topics:
Economy & Growth
Last updated:
apr 23, 2017
Indicators value changes by year
Meaning:
6.896K
Minimum:
6.397K
jan 1, 2010
Maximum:
8.515K
jan 1, 2015
At the date of observation
Value
Absolute change
Change from the previous value
jan 1, 2008
6.89K
+6.89K
0.0%
jan 1, 2009
6.412K
-478.087
-6.94%
jan 1, 2010
6.397K
-14.187
-0.22%
jan 1, 2011
6.479K
+81.373
1.27%
jan 1, 2012
6.459K
-20.074
-0.31%
jan 1, 2013
6.823K
+364.221
5.64%
jan 1, 2014
7.196K
+373.163
5.47%
jan 1, 2015
8.515K
+1.319K
18.33%
Ranking of countries by current statistics by years