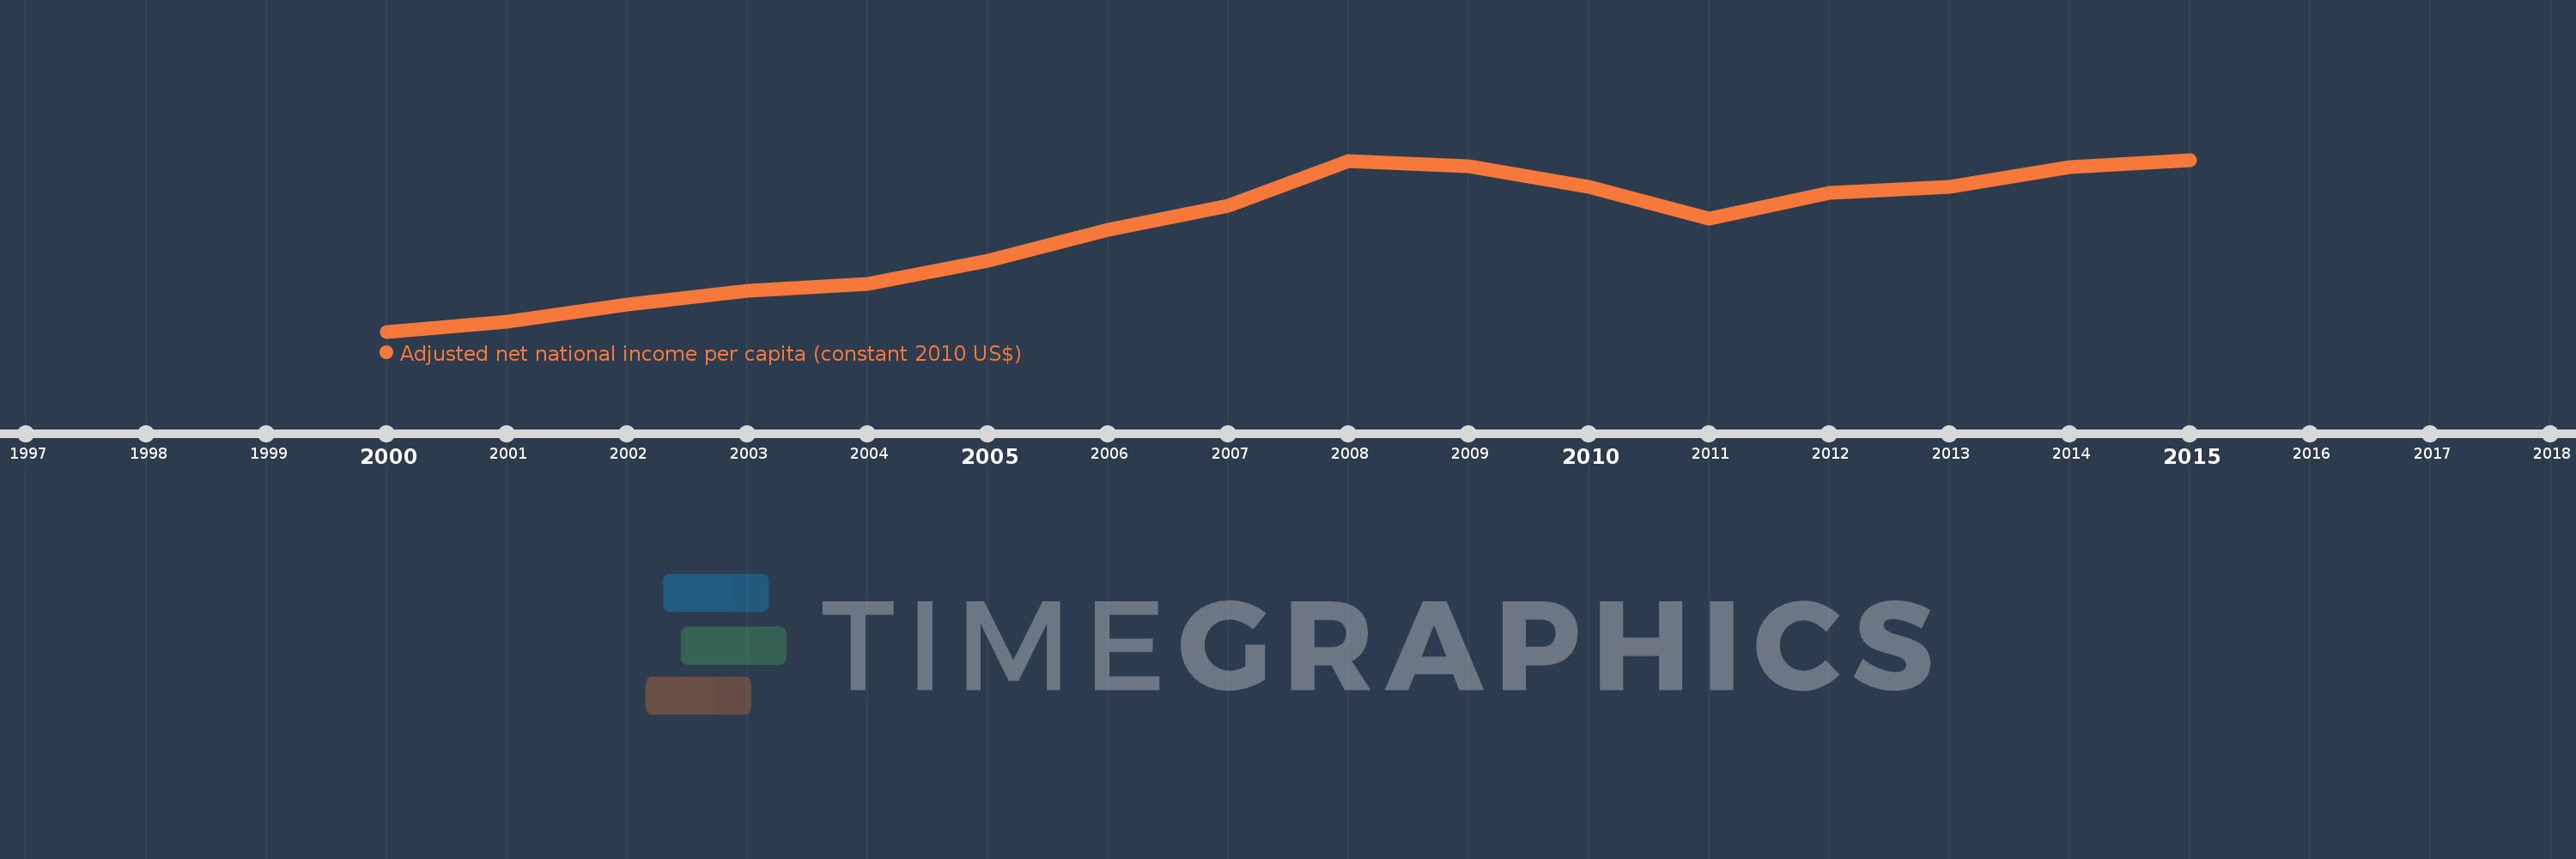
This timeline shows a graph from 2000 to 2015 of Latvia. No data until 1999. Number of actual observations by date: 16.
Source name:
World Development Indicators
Source organization:
NULWorld Bank staff estimates based on sources and methods in World Bank's "The Changing Wealth of Nations: Measuring Sustainable Development in the New Millennium" (2011).L
Categories, topics:
Economy & Growth
Last updated:
apr 23, 2017
Indicators value changes by year
Meaning:
8.154K
Minimum:
4.976K
jan 1, 2000
Maximum:
10.308K
jan 1, 2015
At the date of observation
Value
Absolute change
Change from the previous value
jan 1, 2000
4.976K
+4.976K
0.0%
jan 1, 2001
5.278K
+301.763
6.06%
jan 1, 2002
5.803K
+524.806
9.94%
jan 1, 2003
6.232K
+429.578
7.4%
jan 1, 2004
6.461K
+228.923
3.67%
jan 1, 2005
7.186K
+725.129
11.22%
jan 1, 2006
8.138K
+951.601
13.24%
jan 1, 2007
8.894K
+755.936
9.29%
jan 1, 2008
10.262K
+1.368K
15.38%
jan 1, 2009
10.116K
-145.835
-1.42%
jan 1, 2010
9.478K
-637.723
-6.3%
jan 1, 2011
8.49K
-988.605
-10.43%
jan 1, 2012
9.287K
+797.558
9.39%
jan 1, 2013
9.48K
+192.57
2.07%
jan 1, 2014
10.081K
+600.592
6.34%
jan 1, 2015
10.308K
+227.597
2.26%
Ranking of countries by current statistics by years