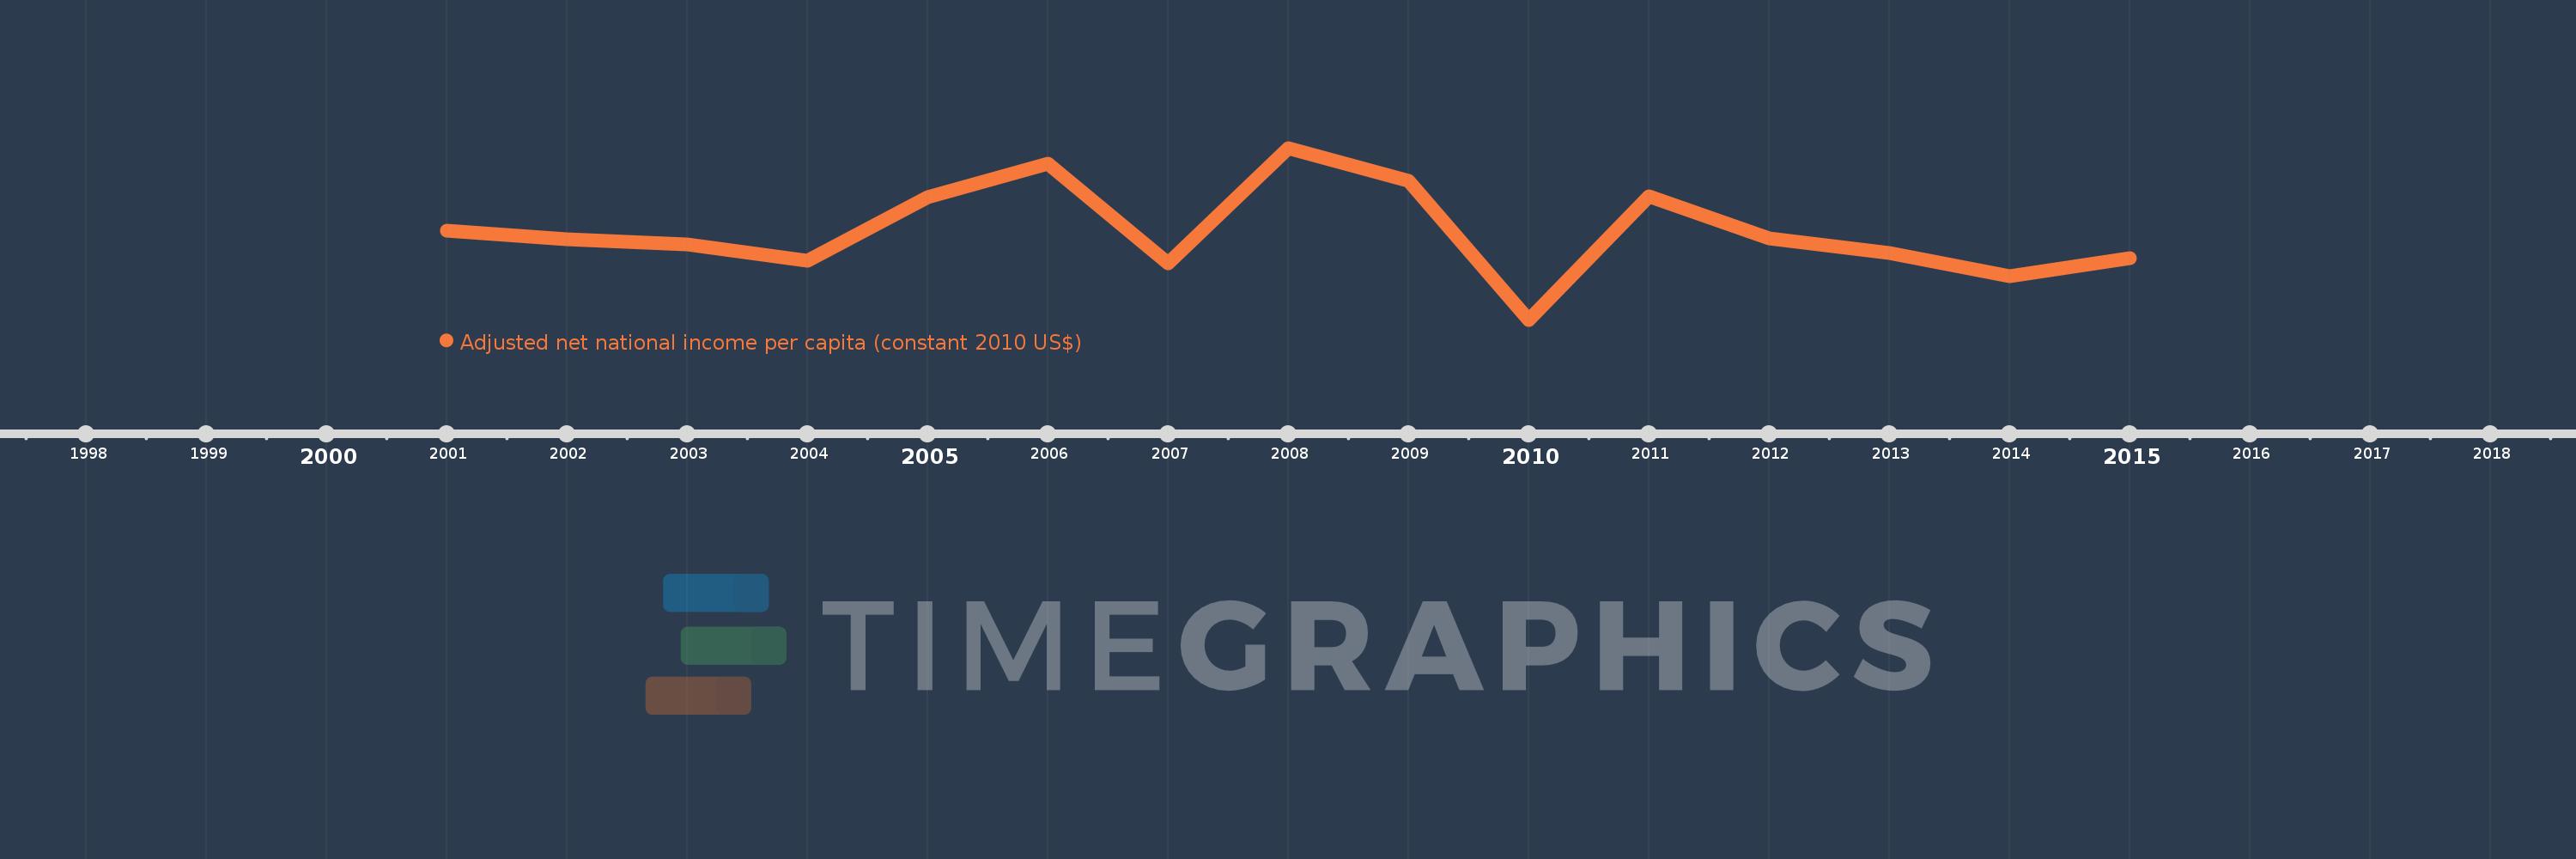
This timeline shows a graph from 2001 to 2015 of Luxembourg. No data until 2000. Number of actual observations by date: 15.
Source name:
World Development Indicators
Source organization:
NULWorld Bank staff estimates based on sources and methods in World Bank's "The Changing Wealth of Nations: Measuring Sustainable Development in the New Millennium" (2011).L
Categories, topics:
Economy & Growth
Last updated:
apr 23, 2017
Indicators value changes by year
Meaning:
60.215K
Minimum:
52.362K
jan 1, 2010
Maximum:
67.634K
jan 1, 2008
At the date of observation
Value
Absolute change
Change from the previous value
jan 1, 2001
60.265K
+60.265K
0.0%
jan 1, 2002
59.495K
-770.262
-1.28%
jan 1, 2003
59.081K
-413.353
-0.69%
jan 1, 2004
57.615K
-1.467K
-2.48%
jan 1, 2005
63.246K
+5.631K
9.77%
jan 1, 2006
66.245K
+2.999K
4.74%
jan 1, 2007
57.345K
-8.9K
-13.43%
jan 1, 2008
67.634K
+10.29K
17.94%
jan 1, 2009
64.682K
-2.953K
-4.37%
jan 1, 2010
52.362K
-12.32K
-19.05%
jan 1, 2011
63.334K
+10.972K
20.95%
jan 1, 2012
59.584K
-3.75K
-5.92%
jan 1, 2013
58.308K
-1.277K
-2.14%
jan 1, 2014
56.203K
-2.104K
-3.61%
jan 1, 2015
57.828K
+1.624K
2.89%
Ranking of countries by current statistics by years