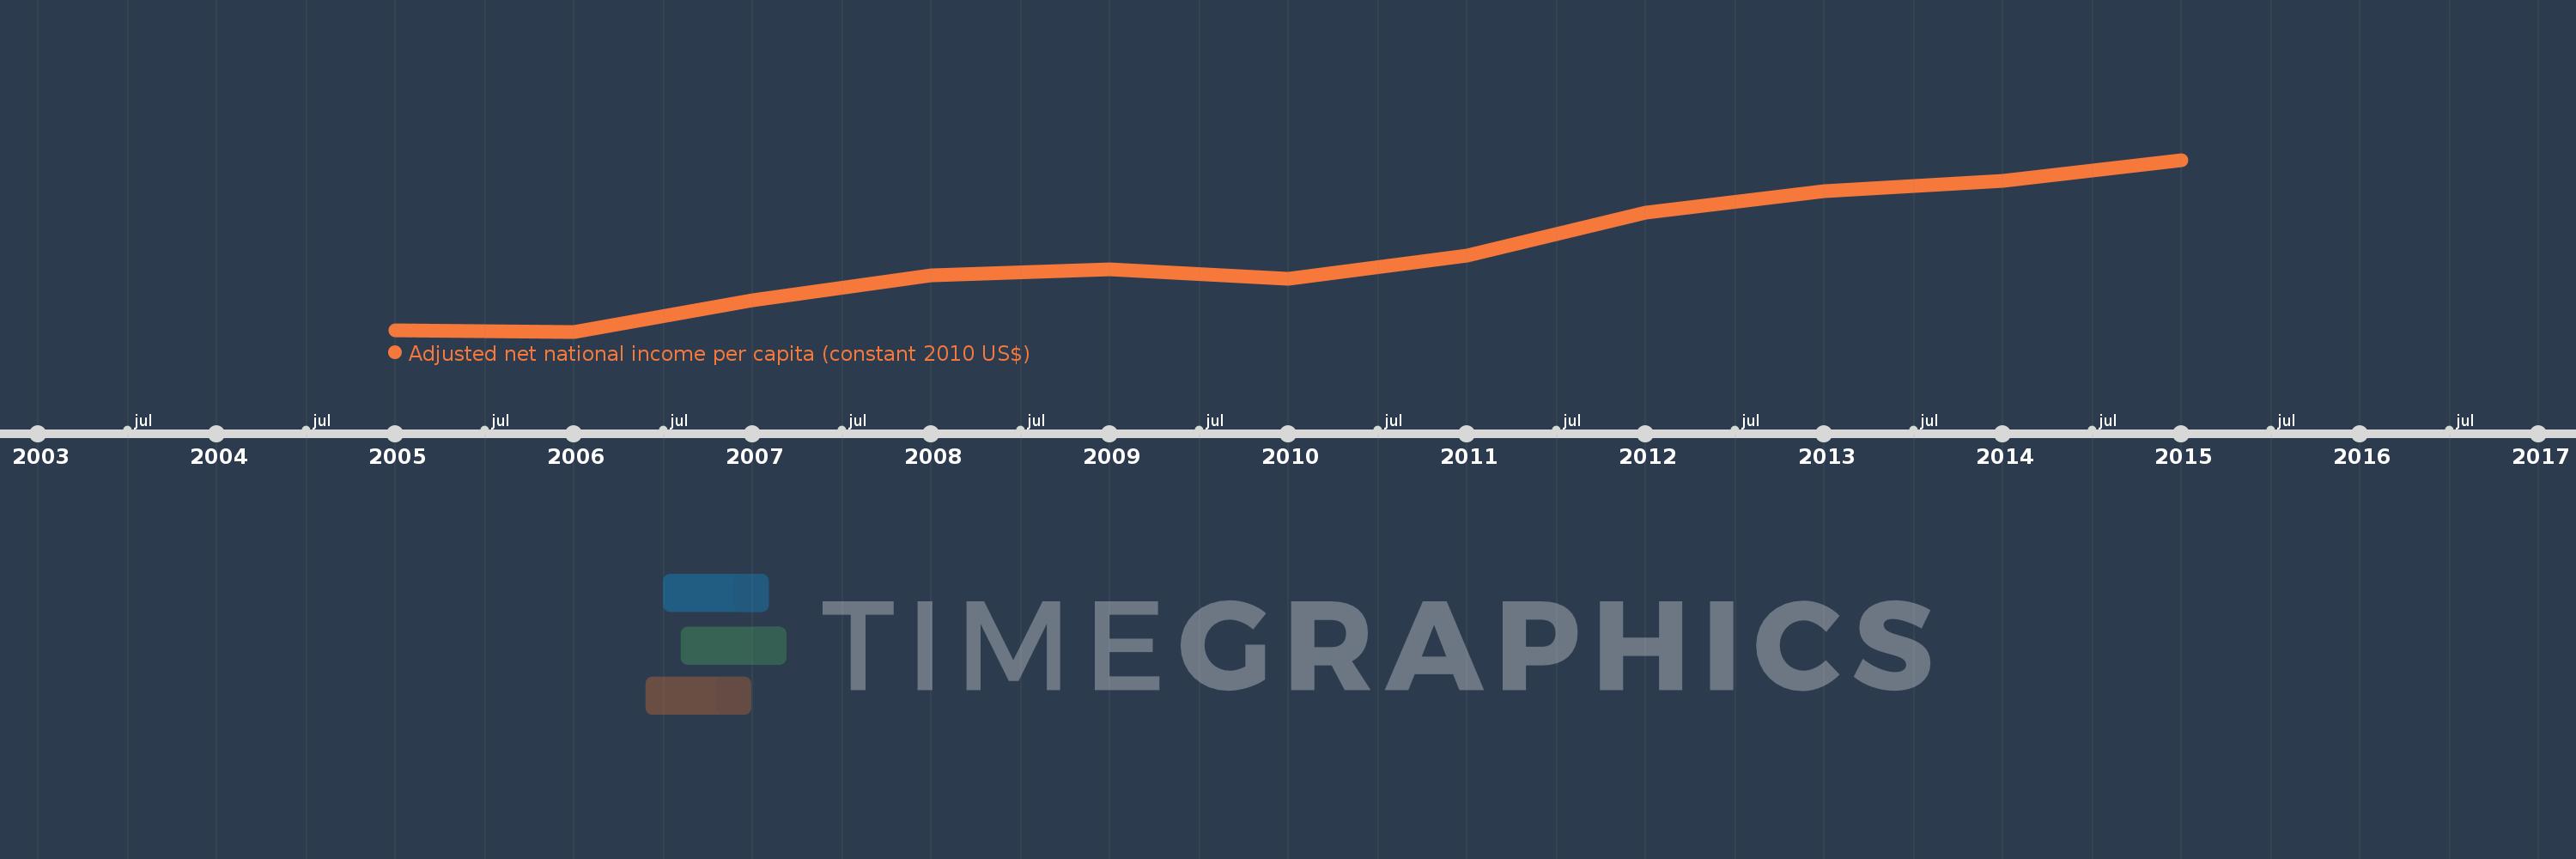
This timeline shows a graph from 2005 to 2015 of Small states. No data until 2004. Number of actual observations by date: 11.
Source name:
World Development Indicators
Source organization:
NULWorld Bank staff estimates based on sources and methods in World Bank's "The Changing Wealth of Nations: Measuring Sustainable Development in the New Millennium" (2011).L
Categories, topics:
Economy & Growth
Last updated:
apr 23, 2017
Indicators value changes by year
Meaning:
7.18K
Minimum:
5.378K
jan 1, 2006
Maximum:
9.333K
jan 1, 2015
At the date of observation
Value
Absolute change
Change from the previous value
jan 1, 2005
5.407K
+5.407K
0.0%
jan 1, 2006
5.378K
-29.003
-0.54%
jan 1, 2007
6.104K
+725.335
13.49%
jan 1, 2008
6.677K
+573.331
9.39%
jan 1, 2009
6.812K
+134.557
2.02%
jan 1, 2010
6.587K
-224.573
-3.3%
jan 1, 2011
7.126K
+539.093
8.18%
jan 1, 2012
8.115K
+988.472
13.87%
jan 1, 2013
8.602K
+487.86
6.01%
jan 1, 2014
8.843K
+240.907
2.8%
jan 1, 2015
9.333K
+490.123
5.54%
Ranking of countries by current statistics by years