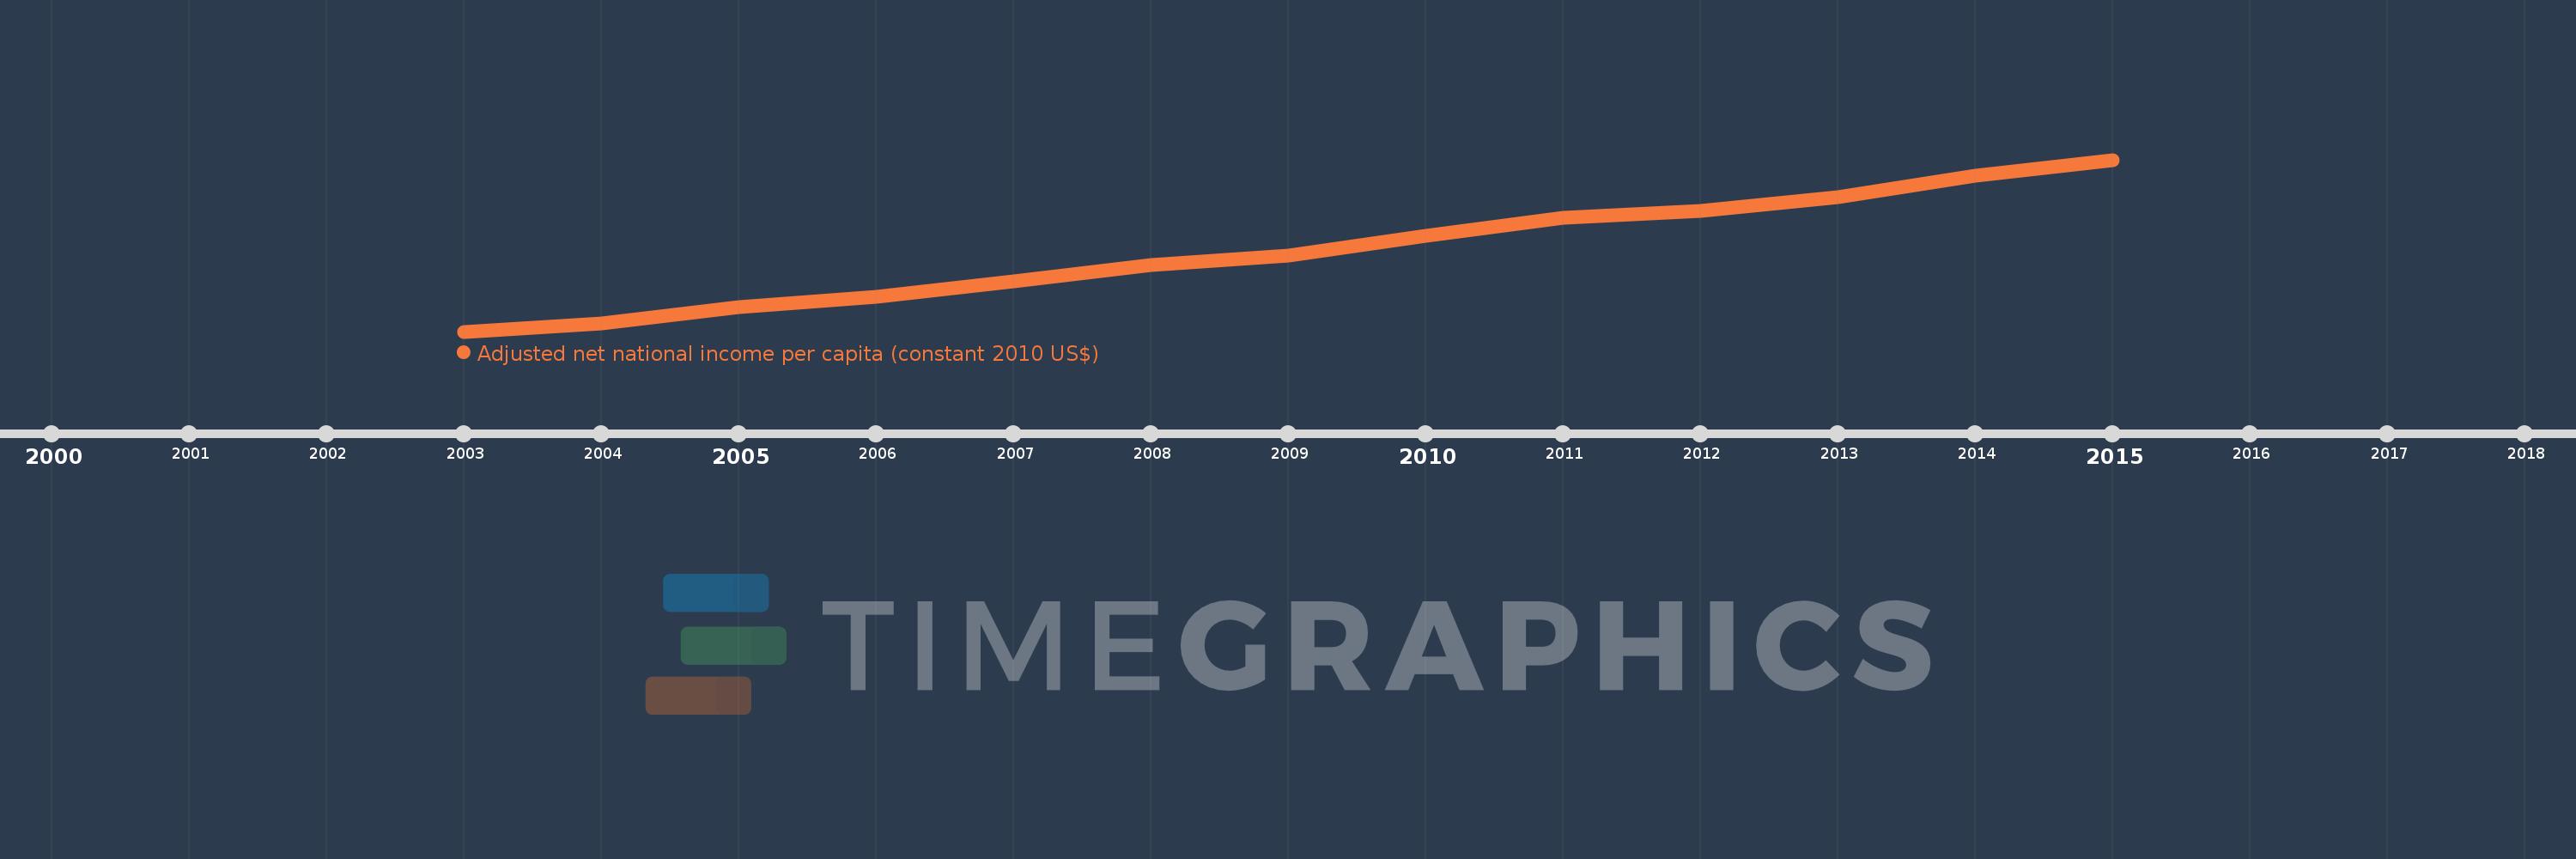
This timeline shows a graph from 2003 to 2015 of Least developed countries: UN classification. No data until 2002. Number of actual observations by date: 13.
Source name:
World Development Indicators
Source organization:
NULWorld Bank staff estimates based on sources and methods in World Bank's "The Changing Wealth of Nations: Measuring Sustainable Development in the New Millennium" (2011).L
Categories, topics:
Economy & Growth
Last updated:
apr 23, 2017
Indicators value changes by year
Meaning:
570.114
Minimum:
473.744
jan 1, 2003
Maximum:
677.996
jan 1, 2015
At the date of observation
Value
Absolute change
Change from the previous value
jan 1, 2003
473.744
+473.744
0.0%
jan 1, 2004
483.518
+9.773
2.06%
jan 1, 2005
502.686
+19.169
3.96%
jan 1, 2006
515.521
+12.835
2.55%
jan 1, 2007
533.058
+17.536
3.4%
jan 1, 2008
553.306
+20.248
3.8%
jan 1, 2009
564.209
+10.903
1.97%
jan 1, 2010
587.949
+23.74
4.21%
jan 1, 2011
608.974
+21.024
3.58%
jan 1, 2012
617.081
+8.108
1.33%
jan 1, 2013
633.977
+16.895
2.74%
jan 1, 2014
659.462
+25.485
4.02%
jan 1, 2015
677.996
+18.534
2.81%
Ranking of countries by current statistics by years