29
/
en
AIzaSyAYiBZKx7MnpbEhh9jyipgxe19OcubqV5w
April 1, 2024
47170
Lower middle income
LMC
false
2
1
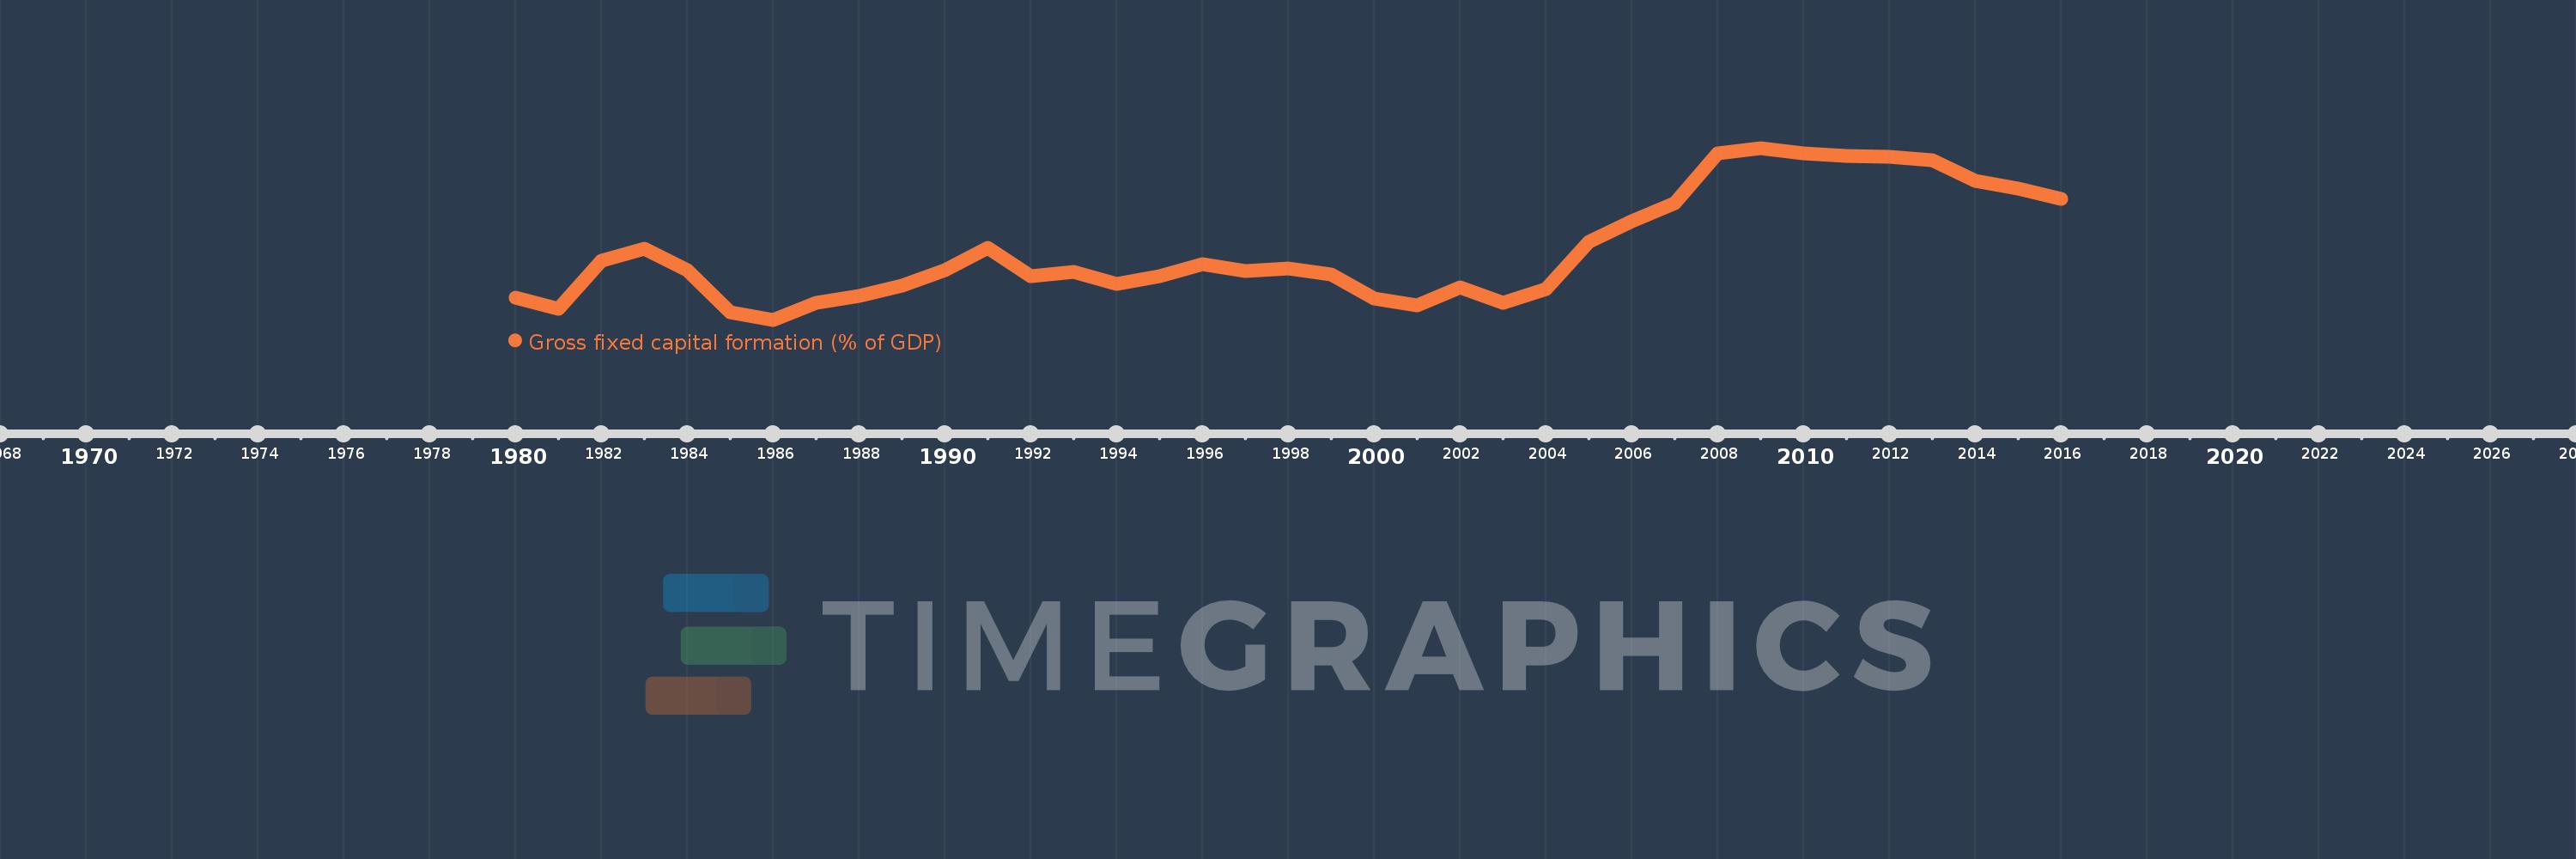
Gross fixed capital formation (% of GDP)
2016,2015,2014,2013,2012,2011,2010,2009,2008,2007,2006,2005,2004,2003,2002,2001,2000,1999,1998,1997,1996,1995,1994,1993,1992,1991,1990,1989,1988,1987,1986,1985,1984,1983,1982,1981,1980
This statistics in other country:
AfghanistanAlbaniaAlgeriaAngolaAntigua and BarbudaArab WorldArgentinaArmeniaArubaAustraliaAustriaAzerbaijanBahamas, TheBahrainBangladeshBarbadosBelarusBelgiumBelizeBeninBermudaBhutanBoliviaBosnia and HerzegovinaBotswanaBrazilBrunei DarussalamBulgariaBurkina FasoBurundiCabo VerdeCambodiaCameroonCanadaCaribbean small statesCentral African RepublicCentral Europe and the BalticsChadChileChinaColombiaComorosCongo, Dem. Rep.Congo, Rep.Costa RicaCote d'IvoireCroatiaCubaCyprusCzech RepublicDenmarkDjiboutiDominicaDominican RepublicEarly-demographic dividendEast Asia & PacificEast Asia & Pacific (excluding high income)East Asia & Pacific (IDA & IBRD countries)EcuadorEgypt, Arab Rep.El SalvadorEquatorial GuineaEritreaEstoniaEthiopiaEuro areaEurope & Central AsiaEurope & Central Asia (excluding high income)Europe & Central Asia (IDA & IBRD countries)European UnionFijiFinlandFragile and conflict affected situationsFranceGabonGambia, TheGeorgiaGermanyGhanaGreeceGrenadaGuatemalaGuineaGuinea-BissauGuyanaHaitiHeavily indebted poor countries (HIPC)High incomeHondurasHong Kong SAR, ChinaHungaryIBRD onlyIcelandIDA & IBRD totalIDA blendIDA onlyIDA totalIndiaIndonesiaIran, Islamic Rep.IraqIrelandIsraelItalyJamaicaJapanJordanKazakhstanKenyaKiribatiKorea, Rep.KosovoKuwaitKyrgyz RepublicLao PDRLate-demographic dividendLatin America & Caribbean Latin America & Caribbean (excluding high income)Latin America & the Caribbean (IDA & IBRD countries)LatviaLeast developed countries: UN classificationLebanonLesothoLiberiaLibyaLithuaniaLow & middle incomeLow incomeLower middle incomeLuxembourgMacao SAR, ChinaMacedonia, FYRMadagascarMalawiMalaysiaMaldivesMaliMaltaMauritaniaMauritiusMexicoMicronesia, Fed. Sts.Middle East & North AfricaMiddle East & North Africa (excluding high income)Middle East & North Africa (IDA & IBRD countries)Middle incomeMoldovaMongoliaMontenegroMoroccoMozambiqueNamibiaNepalNetherlandsNew CaledoniaNew ZealandNicaraguaNigerNigeriaNorth AmericaNorwayOECD membersOmanPacific island small statesPakistanPanamaPapua New GuineaParaguayPeruPhilippinesPolandPortugalPost-demographic dividendPre-demographic dividendPuerto RicoRomaniaRussian FederationRwandaSaudi ArabiaSenegalSerbiaSeychellesSierra LeoneSingaporeSlovak RepublicSloveniaSolomon IslandsSomaliaSouth AfricaSouth AsiaSouth Asia (IDA & IBRD)South SudanSpainSri LankaSt. Kitts and NevisSt. LuciaSt. Vincent and the GrenadinesSub-Saharan Africa Sub-Saharan Africa (excluding high income)Sub-Saharan Africa (IDA & IBRD countries)SudanSurinameSwazilandSwedenSwitzerlandSyrian Arab RepublicTajikistanTanzaniaThailandTimor-LesteTogoTongaTrinidad and TobagoTunisiaTurkeyTurkmenistanUgandaUkraineUnited Arab EmiratesUnited KingdomUnited StatesUpper middle incomeUruguayUzbekistanVanuatuVenezuela, RBVietnamWest Bank and GazaWorldYemen, Rep.ZambiaZimbabwe Timeline:
This timeline shows a graph from 1980 to 2016 of Lower middle income. No data until 1979. Number of actual observations by date: 37.
Source name:
World Development Indicators
Source organization:
World Bank national accounts data, and OECD National Accounts data files.
Categories, topics:
Economy & Growth
Last updated:
apr 23, 2017
Indicators value changes by year
Minimum:
19.951
jan 1, 1986
Maximum:
27.544
jan 1, 2009
At the date of observation
Value
Absolute change
Change from previous value
jan 1, 1980
20.932
+20.932
0.0%
jan 1, 1981
20.433
-0.499
-2.39%
jan 1, 1982
22.576
+2.143
10.49%
jan 1, 1983
23.097
+0.521
2.31%
jan 1, 1984
22.136
-0.961
-4.16%
jan 1, 1985
20.278
-1.859
-8.4%
jan 1, 1986
19.951
-0.327
-1.61%
jan 1, 1987
20.683
+0.733
3.67%
jan 1, 1988
21.017
+0.333
1.61%
jan 1, 1989
21.457
+0.44
2.09%
jan 1, 1990
22.135
+0.679
3.16%
jan 1, 1991
23.115
+0.98
4.43%
jan 1, 1992
21.866
-1.249
-5.41%
jan 1, 1993
22.077
+0.211
0.96%
jan 1, 1994
21.543
-0.534
-2.42%
jan 1, 1995
21.864
+0.321
1.49%
jan 1, 1996
22.405
+0.541
2.47%
jan 1, 1997
22.121
-0.284
-1.27%
jan 1, 1998
22.208
+0.086
0.39%
jan 1, 1999
21.961
-0.246
-1.11%
jan 1, 2000
20.878
-1.084
-4.93%
jan 1, 2001
20.575
-0.303
-1.45%
jan 1, 2002
21.4
+0.825
4.01%
jan 1, 2003
20.717
-0.683
-3.19%
jan 1, 2004
21.288
+0.572
2.76%
jan 1, 2005
23.388
+2.099
9.86%
jan 1, 2006
24.312
+0.924
3.95%
jan 1, 2007
25.105
+0.793
3.26%
jan 1, 2008
27.314
+2.209
8.8%
jan 1, 2009
27.544
+0.229
0.84%
jan 1, 2010
27.313
-0.231
-0.84%
jan 1, 2011
27.177
-0.135
-0.5%
jan 1, 2012
27.138
-0.039
-0.14%
jan 1, 2013
27.018
-0.121
-0.44%
jan 1, 2014
26.073
-0.945
-3.5%
jan 1, 2015
25.732
-0.341
-1.31%
jan 1, 2016
25.286
-0.446
-1.73%
Ranking of countries by current statistics by years


Comments: