29
/
en
AIzaSyAYiBZKx7MnpbEhh9jyipgxe19OcubqV5w
April 1, 2024
238316
Seychelles
SYC
true
2
1
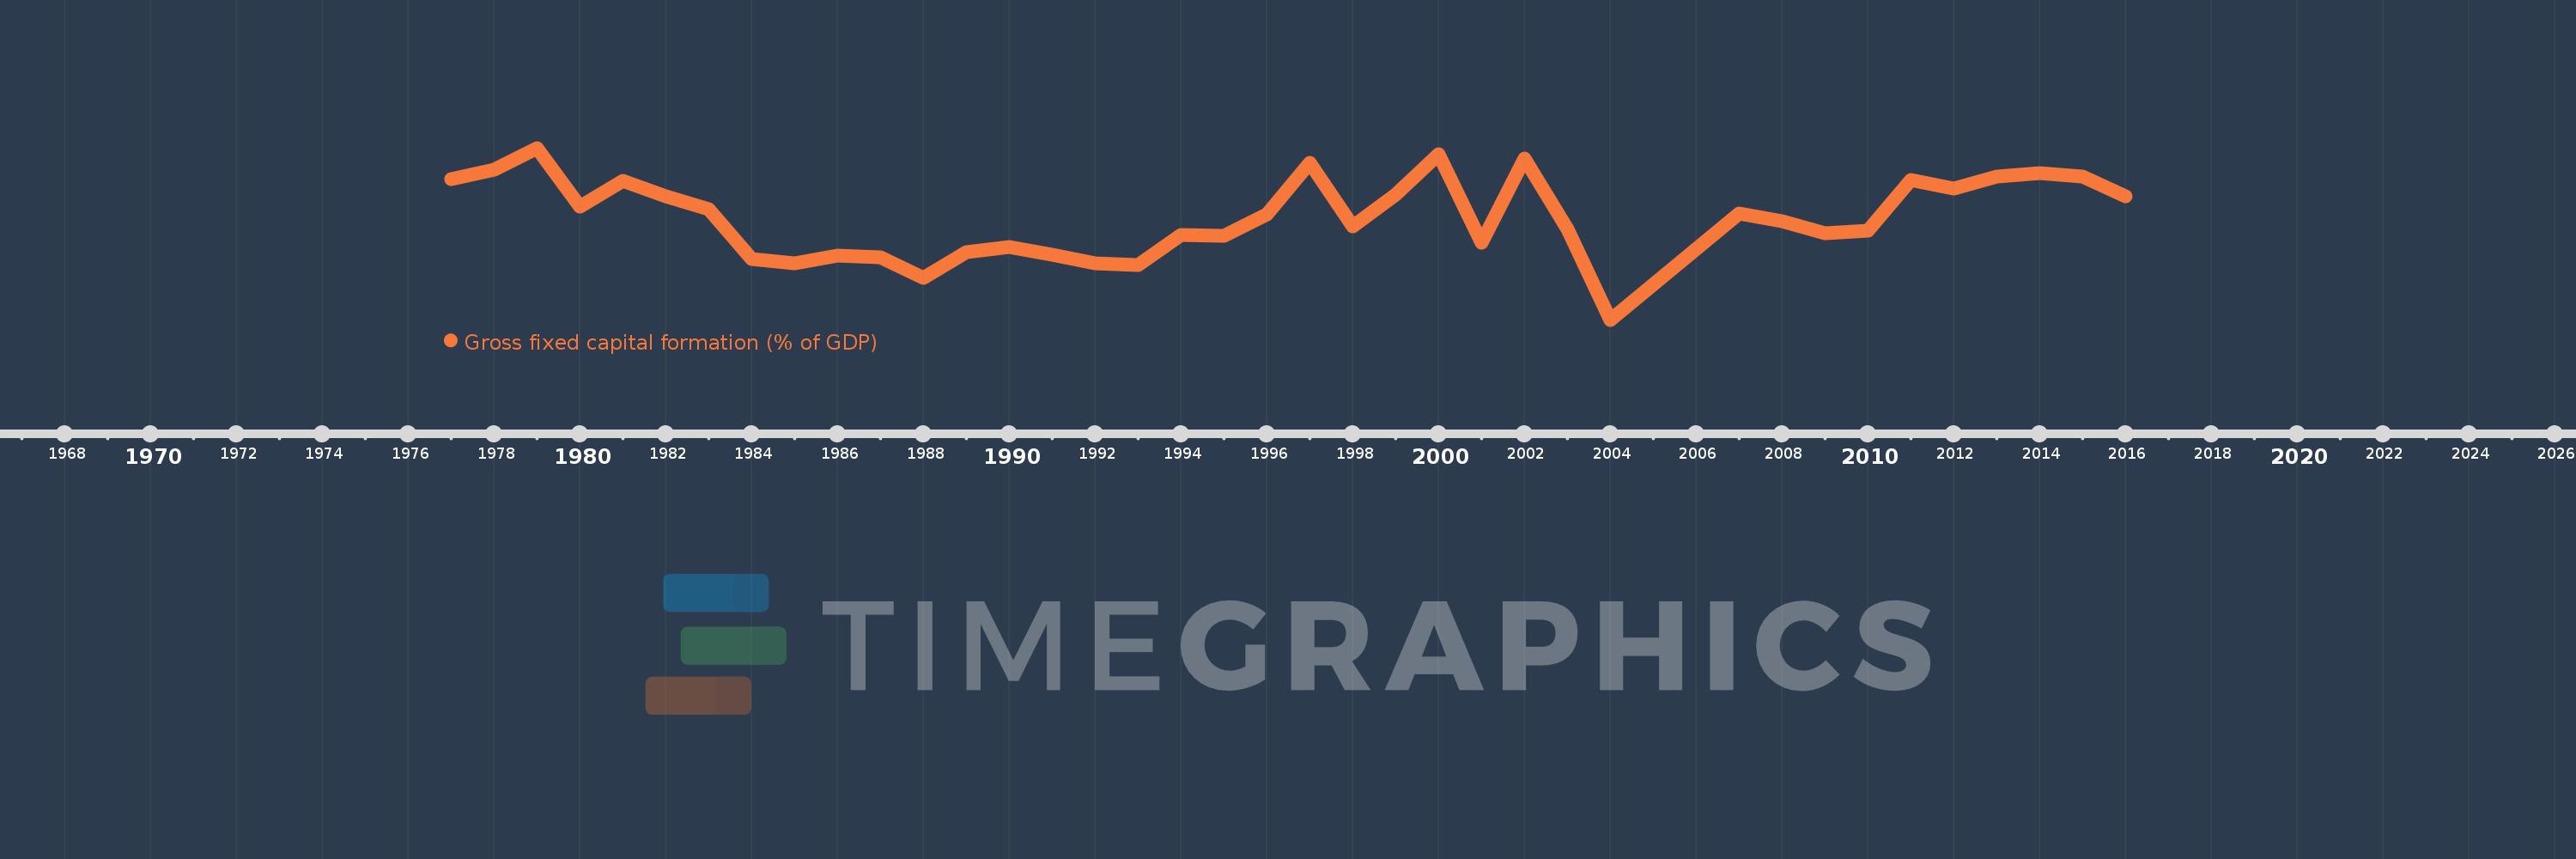
Gross fixed capital formation (% of GDP)
2016,2015,2014,2013,2012,2011,2010,2009,2008,2007,2004,2003,2002,2001,2000,1999,1998,1997,1996,1995,1994,1993,1992,1991,1990,1989,1988,1987,1986,1985,1984,1983,1982,1981,1980,1979,1978,1977
This statistics in other country:
AfghanistanAlbaniaAlgeriaAngolaAntigua and BarbudaArab WorldArgentinaArmeniaArubaAustraliaAustriaAzerbaijanBahamas, TheBahrainBangladeshBarbadosBelarusBelgiumBelizeBeninBermudaBhutanBoliviaBosnia and HerzegovinaBotswanaBrazilBrunei DarussalamBulgariaBurkina FasoBurundiCabo VerdeCambodiaCameroonCanadaCaribbean small statesCentral African RepublicCentral Europe and the BalticsChadChileChinaColombiaComorosCongo, Dem. Rep.Congo, Rep.Costa RicaCote d'IvoireCroatiaCubaCyprusCzech RepublicDenmarkDjiboutiDominicaDominican RepublicEarly-demographic dividendEast Asia & PacificEast Asia & Pacific (excluding high income)East Asia & Pacific (IDA & IBRD countries)EcuadorEgypt, Arab Rep.El SalvadorEquatorial GuineaEritreaEstoniaEthiopiaEuro areaEurope & Central AsiaEurope & Central Asia (excluding high income)Europe & Central Asia (IDA & IBRD countries)European UnionFijiFinlandFragile and conflict affected situationsFranceGabonGambia, TheGeorgiaGermanyGhanaGreeceGrenadaGuatemalaGuineaGuinea-BissauGuyanaHaitiHeavily indebted poor countries (HIPC)High incomeHondurasHong Kong SAR, ChinaHungaryIBRD onlyIcelandIDA & IBRD totalIDA blendIDA onlyIDA totalIndiaIndonesiaIran, Islamic Rep.IraqIrelandIsraelItalyJamaicaJapanJordanKazakhstanKenyaKiribatiKorea, Rep.KosovoKuwaitKyrgyz RepublicLao PDRLate-demographic dividendLatin America & Caribbean Latin America & Caribbean (excluding high income)Latin America & the Caribbean (IDA & IBRD countries)LatviaLeast developed countries: UN classificationLebanonLesothoLiberiaLibyaLithuaniaLow & middle incomeLow incomeLower middle incomeLuxembourgMacao SAR, ChinaMacedonia, FYRMadagascarMalawiMalaysiaMaldivesMaliMaltaMauritaniaMauritiusMexicoMicronesia, Fed. Sts.Middle East & North AfricaMiddle East & North Africa (excluding high income)Middle East & North Africa (IDA & IBRD countries)Middle incomeMoldovaMongoliaMontenegroMoroccoMozambiqueNamibiaNepalNetherlandsNew CaledoniaNew ZealandNicaraguaNigerNigeriaNorth AmericaNorwayOECD membersOmanPacific island small statesPakistanPanamaPapua New GuineaParaguayPeruPhilippinesPolandPortugalPost-demographic dividendPre-demographic dividendPuerto RicoRomaniaRussian FederationRwandaSaudi ArabiaSenegalSerbiaSeychellesSierra LeoneSingaporeSlovak RepublicSloveniaSolomon IslandsSomaliaSouth AfricaSouth AsiaSouth Asia (IDA & IBRD)South SudanSpainSri LankaSt. Kitts and NevisSt. LuciaSt. Vincent and the GrenadinesSub-Saharan Africa Sub-Saharan Africa (excluding high income)Sub-Saharan Africa (IDA & IBRD countries)SudanSurinameSwazilandSwedenSwitzerlandSyrian Arab RepublicTajikistanTanzaniaThailandTimor-LesteTogoTongaTrinidad and TobagoTunisiaTurkeyTurkmenistanUgandaUkraineUnited Arab EmiratesUnited KingdomUnited StatesUpper middle incomeUruguayUzbekistanVanuatuVenezuela, RBVietnamWest Bank and GazaWorldYemen, Rep.ZambiaZimbabwe Timeline:
This timeline shows a graph from 1977 to 2016 of Seychelles. No data until 1976. Number of actual observations by date: 38.
Source name:
World Development Indicators
Source organization:
World Bank national accounts data, and OECD National Accounts data files.
Categories, topics:
Economy & Growth
Last updated:
apr 23, 2017
Indicators value changes by year
Minimum:
10.902
jan 1, 2004
Maximum:
42.603
jan 1, 1979
At the date of observation
Value
Absolute change
Change from previous value
jan 1, 1977
36.789
+36.789
0.0%
jan 1, 1978
38.625
+1.836
4.99%
jan 1, 1979
42.603
+3.977
10.3%
jan 1, 1980
31.84
-10.762
-25.26%
jan 1, 1981
36.543
+4.703
14.77%
jan 1, 1982
33.695
-2.849
-7.8%
jan 1, 1983
31.253
-2.442
-7.25%
jan 1, 1984
22.147
-9.105
-29.13%
jan 1, 1985
21.243
-0.904
-4.08%
jan 1, 1986
22.699
+1.456
6.85%
jan 1, 1987
22.347
-0.352
-1.55%
jan 1, 1988
18.633
-3.714
-16.62%
jan 1, 1989
23.383
+4.75
25.49%
jan 1, 1990
24.288
+0.905
3.87%
jan 1, 1991
22.973
-1.315
-5.42%
jan 1, 1992
21.317
-1.656
-7.21%
jan 1, 1993
20.953
-0.364
-1.71%
jan 1, 1994
26.519
+5.566
26.57%
jan 1, 1995
26.368
-0.151
-0.57%
jan 1, 1996
30.325
+3.957
15.01%
jan 1, 1997
39.845
+9.52
31.39%
jan 1, 1998
28.053
-11.791
-29.59%
jan 1, 1999
33.996
+5.942
21.18%
jan 1, 2000
41.487
+7.491
22.04%
jan 1, 2001
25.179
-16.308
-39.31%
jan 1, 2002
40.66
+15.481
61.48%
jan 1, 2003
27.62
-13.04
-32.07%
jan 1, 2004
10.902
-16.717
-60.53%
jan 1, 2007
30.444
+19.542
179.24%
jan 1, 2008
29.021
-1.423
-4.67%
jan 1, 2009
26.905
-2.116
-7.29%
jan 1, 2010
27.278
+0.373
1.39%
jan 1, 2011
36.625
+9.347
34.27%
jan 1, 2012
35.033
-1.592
-4.35%
jan 1, 2013
37.371
+2.338
6.67%
jan 1, 2014
37.902
+0.531
1.42%
jan 1, 2015
37.319
-0.583
-1.54%
jan 1, 2016
33.728
-3.591
-9.62%
Ranking of countries by current statistics by years


Comments: