29
/
en
AIzaSyAYiBZKx7MnpbEhh9jyipgxe19OcubqV5w
April 1, 2024
275748
United Kingdom
GBR
true
2
1
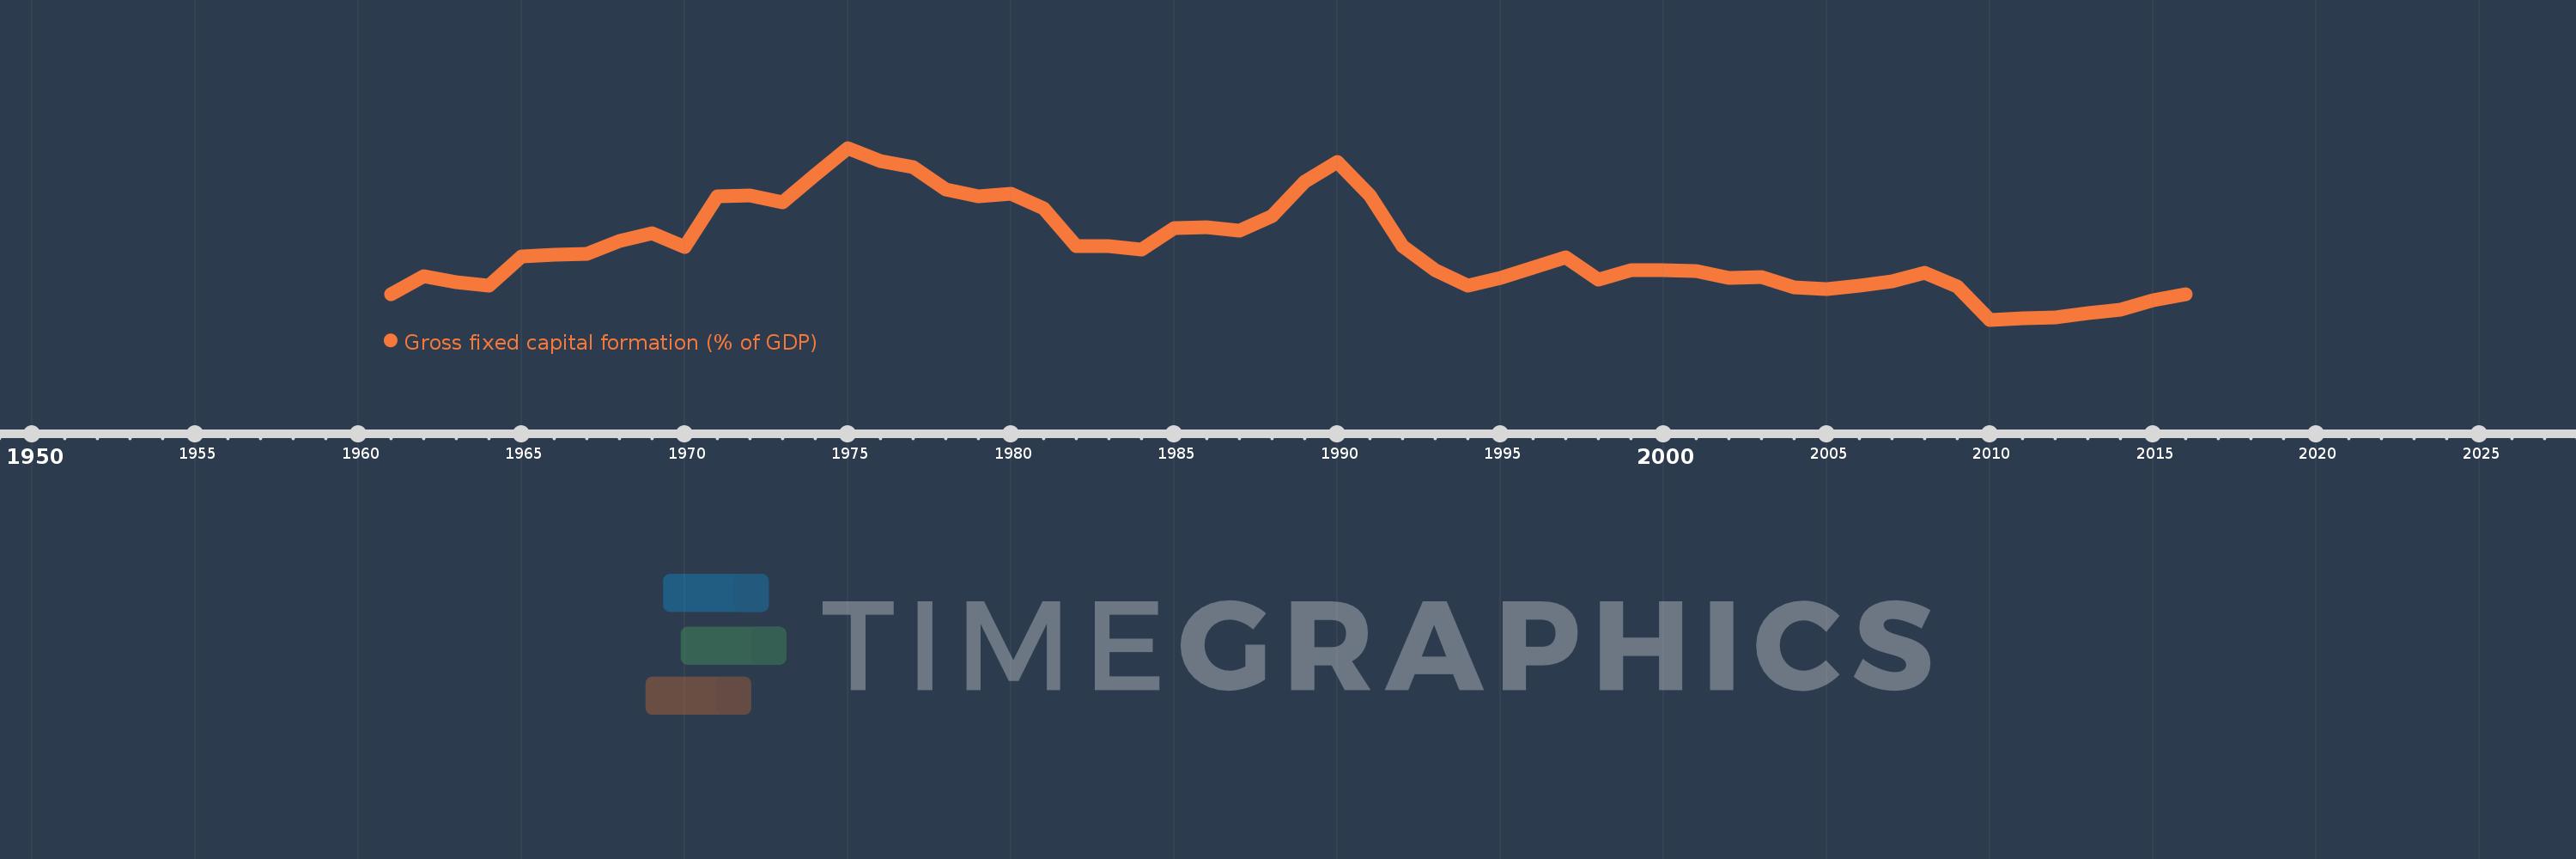
Gross fixed capital formation (% of GDP)
2016,2015,2014,2013,2012,2011,2010,2009,2008,2007,2006,2005,2004,2003,2002,2001,2000,1999,1998,1997,1996,1995,1994,1993,1992,1991,1990,1989,1988,1987,1986,1985,1984,1983,1982,1981,1980,1979,1978,1977,1976,1975,1974,1973,1972,1971,1970,1969,1968,1967,1966,1965,1964,1963,1962,1961
This statistics in other country:
AfghanistanAlbaniaAlgeriaAngolaAntigua and BarbudaArab WorldArgentinaArmeniaArubaAustraliaAustriaAzerbaijanBahamas, TheBahrainBangladeshBarbadosBelarusBelgiumBelizeBeninBermudaBhutanBoliviaBosnia and HerzegovinaBotswanaBrazilBrunei DarussalamBulgariaBurkina FasoBurundiCabo VerdeCambodiaCameroonCanadaCaribbean small statesCentral African RepublicCentral Europe and the BalticsChadChileChinaColombiaComorosCongo, Dem. Rep.Congo, Rep.Costa RicaCote d'IvoireCroatiaCubaCyprusCzech RepublicDenmarkDjiboutiDominicaDominican RepublicEarly-demographic dividendEast Asia & PacificEast Asia & Pacific (excluding high income)East Asia & Pacific (IDA & IBRD countries)EcuadorEgypt, Arab Rep.El SalvadorEquatorial GuineaEritreaEstoniaEthiopiaEuro areaEurope & Central AsiaEurope & Central Asia (excluding high income)Europe & Central Asia (IDA & IBRD countries)European UnionFijiFinlandFragile and conflict affected situationsFranceGabonGambia, TheGeorgiaGermanyGhanaGreeceGrenadaGuatemalaGuineaGuinea-BissauGuyanaHaitiHeavily indebted poor countries (HIPC)High incomeHondurasHong Kong SAR, ChinaHungaryIBRD onlyIcelandIDA & IBRD totalIDA blendIDA onlyIDA totalIndiaIndonesiaIran, Islamic Rep.IraqIrelandIsraelItalyJamaicaJapanJordanKazakhstanKenyaKiribatiKorea, Rep.KosovoKuwaitKyrgyz RepublicLao PDRLate-demographic dividendLatin America & Caribbean Latin America & Caribbean (excluding high income)Latin America & the Caribbean (IDA & IBRD countries)LatviaLeast developed countries: UN classificationLebanonLesothoLiberiaLibyaLithuaniaLow & middle incomeLow incomeLower middle incomeLuxembourgMacao SAR, ChinaMacedonia, FYRMadagascarMalawiMalaysiaMaldivesMaliMaltaMauritaniaMauritiusMexicoMicronesia, Fed. Sts.Middle East & North AfricaMiddle East & North Africa (excluding high income)Middle East & North Africa (IDA & IBRD countries)Middle incomeMoldovaMongoliaMontenegroMoroccoMozambiqueNamibiaNepalNetherlandsNew CaledoniaNew ZealandNicaraguaNigerNigeriaNorth AmericaNorwayOECD membersOmanPacific island small statesPakistanPanamaPapua New GuineaParaguayPeruPhilippinesPolandPortugalPost-demographic dividendPre-demographic dividendPuerto RicoRomaniaRussian FederationRwandaSaudi ArabiaSenegalSerbiaSeychellesSierra LeoneSingaporeSlovak RepublicSloveniaSolomon IslandsSomaliaSouth AfricaSouth AsiaSouth Asia (IDA & IBRD)South SudanSpainSri LankaSt. Kitts and NevisSt. LuciaSt. Vincent and the GrenadinesSub-Saharan Africa Sub-Saharan Africa (excluding high income)Sub-Saharan Africa (IDA & IBRD countries)SudanSurinameSwazilandSwedenSwitzerlandSyrian Arab RepublicTajikistanTanzaniaThailandTimor-LesteTogoTongaTrinidad and TobagoTunisiaTurkeyTurkmenistanUgandaUkraineUnited Arab EmiratesUnited KingdomUnited StatesUpper middle incomeUruguayUzbekistanVanuatuVenezuela, RBVietnamWest Bank and GazaWorldYemen, Rep.ZambiaZimbabwe Timeline:
This timeline shows a graph from 1961 to 2016 of United Kingdom. No data until 1960. Number of actual observations by date: 56.
Source name:
World Development Indicators
Source organization:
World Bank national accounts data, and OECD National Accounts data files.
Categories, topics:
Economy & Growth
Last updated:
apr 23, 2017
Indicators value changes by year
Maximum:
24.713
jan 1, 1975
At the date of observation
Value
Absolute change
Change from previous value
jan 1, 1961
16.909
+16.909
0.0%
jan 1, 1962
17.899
+0.989
5.85%
jan 1, 1963
17.583
-0.316
-1.76%
jan 1, 1964
17.398
-0.185
-1.05%
jan 1, 1965
18.948
+1.55
8.91%
jan 1, 1966
19.047
+0.099
0.52%
jan 1, 1967
19.062
+0.015
0.08%
jan 1, 1968
19.778
+0.716
3.76%
jan 1, 1969
20.175
+0.396
2.0%
jan 1, 1970
19.452
-0.723
-3.58%
jan 1, 1971
22.137
+2.685
13.81%
jan 1, 1972
22.204
+0.067
0.3%
jan 1, 1973
21.797
-0.407
-1.83%
jan 1, 1974
23.286
+1.489
6.83%
jan 1, 1975
24.713
+1.427
6.13%
jan 1, 1976
24.035
-0.678
-2.75%
jan 1, 1977
23.716
-0.319
-1.33%
jan 1, 1978
22.508
-1.208
-5.09%
jan 1, 1979
22.139
-0.37
-1.64%
jan 1, 1980
22.266
+0.127
0.57%
jan 1, 1981
21.481
-0.785
-3.53%
jan 1, 1982
19.466
-2.015
-9.38%
jan 1, 1983
19.468
+0.002
0.01%
jan 1, 1984
19.313
-0.155
-0.8%
jan 1, 1985
20.458
+1.145
5.93%
jan 1, 1986
20.471
+0.013
0.06%
jan 1, 1987
20.305
-0.166
-0.81%
jan 1, 1988
21.098
+0.793
3.91%
jan 1, 1989
22.923
+1.824
8.65%
jan 1, 1990
23.984
+1.062
4.63%
jan 1, 1991
22.173
-1.811
-7.55%
jan 1, 1992
19.508
-2.665
-12.02%
jan 1, 1993
18.215
-1.293
-6.63%
jan 1, 1994
17.4
-0.815
-4.47%
jan 1, 1995
17.802
+0.401
2.31%
jan 1, 1996
18.324
+0.522
2.93%
jan 1, 1997
18.875
+0.551
3.01%
jan 1, 1998
17.697
-1.177
-6.24%
jan 1, 1999
18.205
+0.508
2.87%
jan 1, 2000
18.21
+0.005
0.03%
jan 1, 2001
18.171
-0.039
-0.21%
jan 1, 2002
17.777
-0.394
-2.17%
jan 1, 2003
17.841
+0.064
0.36%
jan 1, 2004
17.291
-0.55
-3.08%
jan 1, 2005
17.189
-0.102
-0.59%
jan 1, 2006
17.392
+0.203
1.18%
jan 1, 2007
17.597
+0.205
1.18%
jan 1, 2008
18.05
+0.452
2.57%
jan 1, 2009
17.334
-0.716
-3.96%
jan 1, 2010
15.57
-1.764
-10.18%
jan 1, 2011
15.625
+0.054
0.35%
jan 1, 2012
15.675
+0.05
0.32%
jan 1, 2013
15.926
+0.251
1.6%
jan 1, 2014
16.109
+0.183
1.15%
jan 1, 2015
16.598
+0.489
3.04%
jan 1, 2016
16.94
+0.342
2.06%
Ranking of countries by current statistics by years


Comments: