29
/
en
AIzaSyAYiBZKx7MnpbEhh9jyipgxe19OcubqV5w
April 1, 2024
162615
Jamaica
JAM
true
2
1
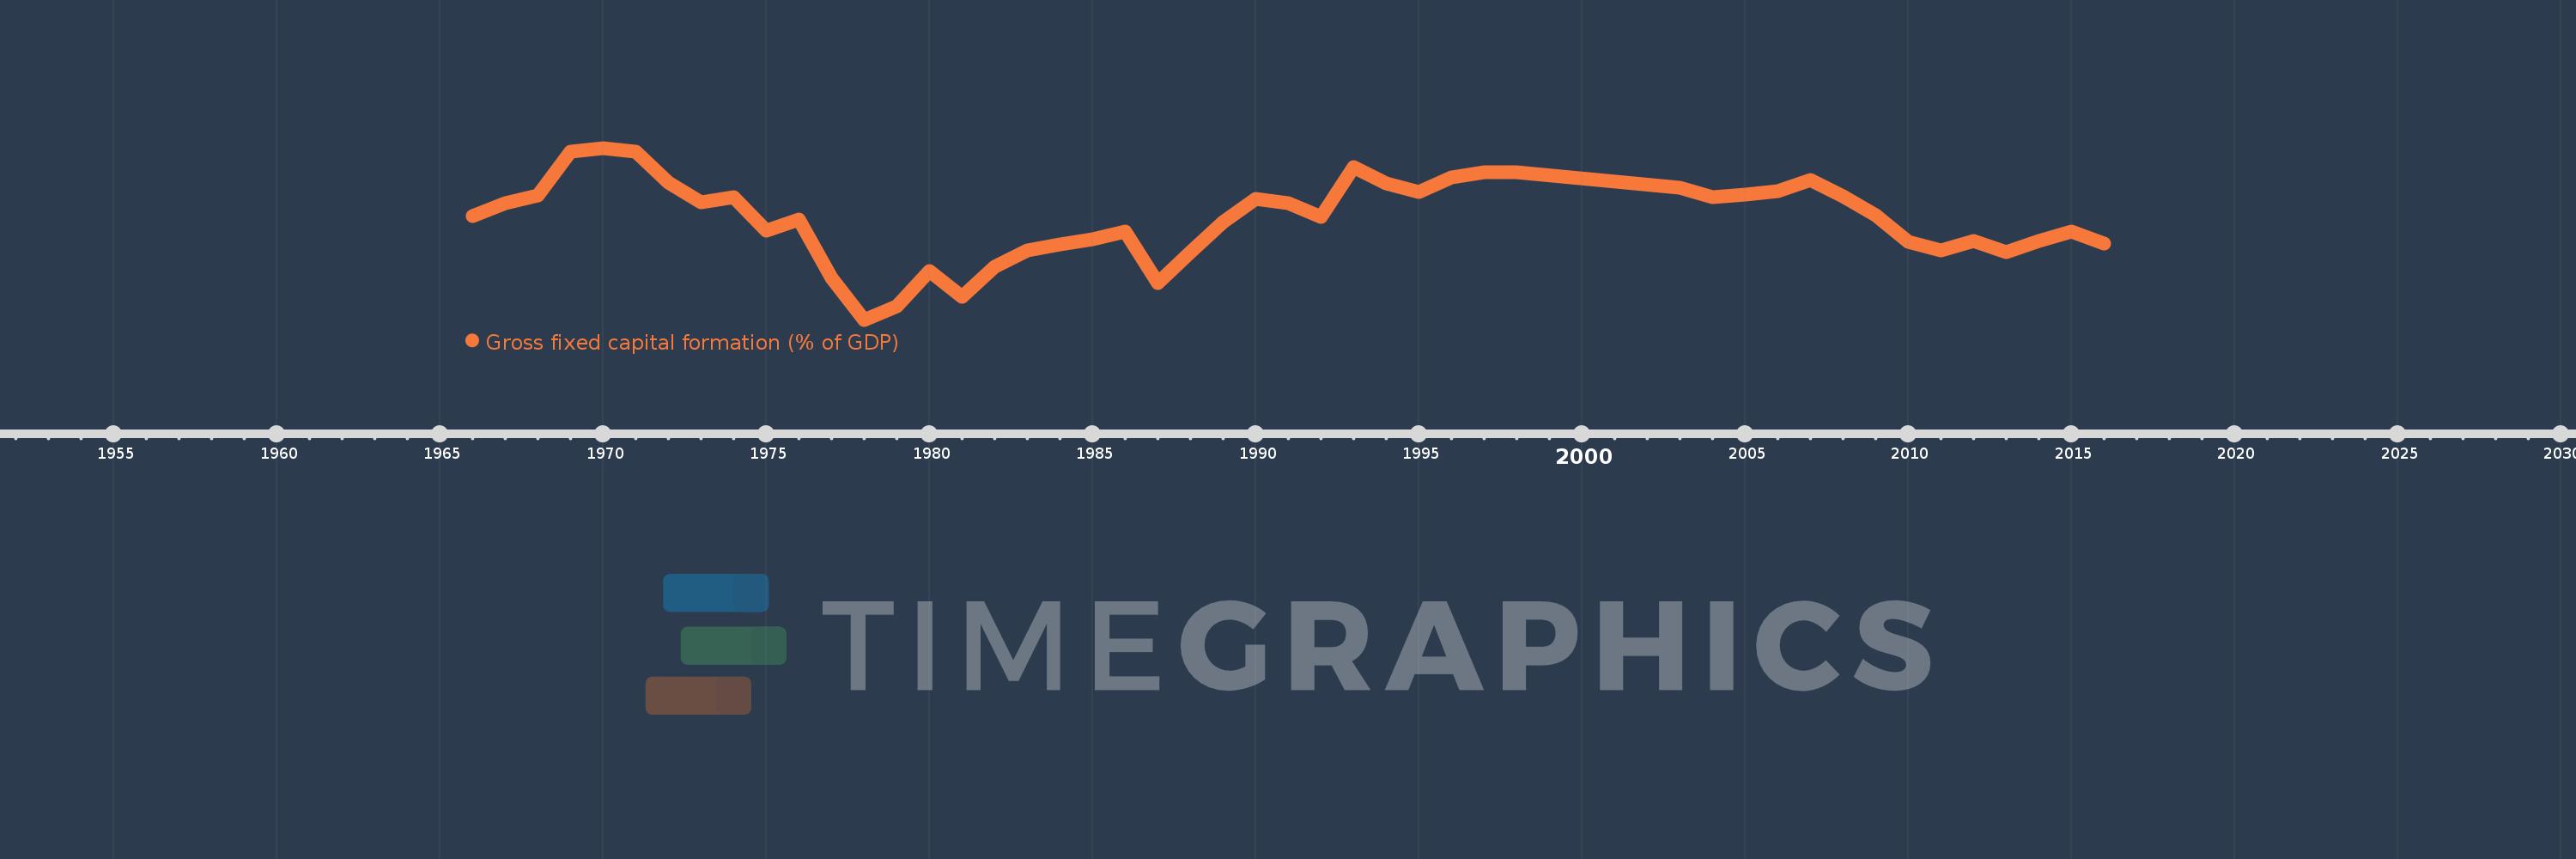
Gross fixed capital formation (% of GDP)
2016,2015,2014,2013,2012,2011,2010,2009,2008,2007,2006,2005,2004,2003,1998,1997,1996,1995,1994,1993,1992,1991,1990,1989,1988,1987,1986,1985,1984,1983,1982,1981,1980,1979,1978,1977,1976,1975,1974,1973,1972,1971,1970,1969,1968,1967,1966
This statistics in other country:
AfghanistanAlbaniaAlgeriaAngolaAntigua and BarbudaArab WorldArgentinaArmeniaArubaAustraliaAustriaAzerbaijanBahamas, TheBahrainBangladeshBarbadosBelarusBelgiumBelizeBeninBermudaBhutanBoliviaBosnia and HerzegovinaBotswanaBrazilBrunei DarussalamBulgariaBurkina FasoBurundiCabo VerdeCambodiaCameroonCanadaCaribbean small statesCentral African RepublicCentral Europe and the BalticsChadChileChinaColombiaComorosCongo, Dem. Rep.Congo, Rep.Costa RicaCote d'IvoireCroatiaCubaCyprusCzech RepublicDenmarkDjiboutiDominicaDominican RepublicEarly-demographic dividendEast Asia & PacificEast Asia & Pacific (excluding high income)East Asia & Pacific (IDA & IBRD countries)EcuadorEgypt, Arab Rep.El SalvadorEquatorial GuineaEritreaEstoniaEthiopiaEuro areaEurope & Central AsiaEurope & Central Asia (excluding high income)Europe & Central Asia (IDA & IBRD countries)European UnionFijiFinlandFragile and conflict affected situationsFranceGabonGambia, TheGeorgiaGermanyGhanaGreeceGrenadaGuatemalaGuineaGuinea-BissauGuyanaHaitiHeavily indebted poor countries (HIPC)High incomeHondurasHong Kong SAR, ChinaHungaryIBRD onlyIcelandIDA & IBRD totalIDA blendIDA onlyIDA totalIndiaIndonesiaIran, Islamic Rep.IraqIrelandIsraelItalyJamaicaJapanJordanKazakhstanKenyaKiribatiKorea, Rep.KosovoKuwaitKyrgyz RepublicLao PDRLate-demographic dividendLatin America & Caribbean Latin America & Caribbean (excluding high income)Latin America & the Caribbean (IDA & IBRD countries)LatviaLeast developed countries: UN classificationLebanonLesothoLiberiaLibyaLithuaniaLow & middle incomeLow incomeLower middle incomeLuxembourgMacao SAR, ChinaMacedonia, FYRMadagascarMalawiMalaysiaMaldivesMaliMaltaMauritaniaMauritiusMexicoMicronesia, Fed. Sts.Middle East & North AfricaMiddle East & North Africa (excluding high income)Middle East & North Africa (IDA & IBRD countries)Middle incomeMoldovaMongoliaMontenegroMoroccoMozambiqueNamibiaNepalNetherlandsNew CaledoniaNew ZealandNicaraguaNigerNigeriaNorth AmericaNorwayOECD membersOmanPacific island small statesPakistanPanamaPapua New GuineaParaguayPeruPhilippinesPolandPortugalPost-demographic dividendPre-demographic dividendPuerto RicoRomaniaRussian FederationRwandaSaudi ArabiaSenegalSerbiaSeychellesSierra LeoneSingaporeSlovak RepublicSloveniaSolomon IslandsSomaliaSouth AfricaSouth AsiaSouth Asia (IDA & IBRD)South SudanSpainSri LankaSt. Kitts and NevisSt. LuciaSt. Vincent and the GrenadinesSub-Saharan Africa Sub-Saharan Africa (excluding high income)Sub-Saharan Africa (IDA & IBRD countries)SudanSurinameSwazilandSwedenSwitzerlandSyrian Arab RepublicTajikistanTanzaniaThailandTimor-LesteTogoTongaTrinidad and TobagoTunisiaTurkeyTurkmenistanUgandaUkraineUnited Arab EmiratesUnited KingdomUnited StatesUpper middle incomeUruguayUzbekistanVanuatuVenezuela, RBVietnamWest Bank and GazaWorldYemen, Rep.ZambiaZimbabwe Timeline:
This timeline shows a graph from 1966 to 2016 of Jamaica. No data until 1965. Number of actual observations by date: 47.
Source name:
World Development Indicators
Source organization:
World Bank national accounts data, and OECD National Accounts data files.
Categories, topics:
Economy & Growth
Last updated:
apr 23, 2017
Indicators value changes by year
Maximum:
31.762
jan 1, 1970
At the date of observation
Value
Absolute change
Change from previous value
jan 1, 1966
23.877
+23.877
0.0%
jan 1, 1967
25.402
+1.525
6.39%
jan 1, 1968
26.281
+0.879
3.46%
jan 1, 1969
31.3
+5.019
19.1%
jan 1, 1970
31.762
+0.462
1.48%
jan 1, 1971
31.36
-0.402
-1.27%
jan 1, 1972
27.76
-3.6
-11.48%
jan 1, 1973
25.488
-2.272
-8.19%
jan 1, 1974
26.06
+0.572
2.24%
jan 1, 1975
22.147
-3.913
-15.01%
jan 1, 1976
23.443
+1.295
5.85%
jan 1, 1977
16.719
-6.724
-28.68%
jan 1, 1978
11.83
-4.888
-29.24%
jan 1, 1979
13.349
+1.519
12.84%
jan 1, 1980
17.483
+4.134
30.97%
jan 1, 1981
14.458
-3.024
-17.3%
jan 1, 1982
17.973
+3.515
24.31%
jan 1, 1983
19.904
+1.931
10.75%
jan 1, 1984
20.54
+0.636
3.19%
jan 1, 1985
21.165
+0.625
3.04%
jan 1, 1986
22.11
+0.945
4.47%
jan 1, 1987
16.116
-5.994
-27.11%
jan 1, 1988
19.655
+3.538
21.96%
jan 1, 1989
23.155
+3.5
17.81%
jan 1, 1990
25.837
+2.683
11.59%
jan 1, 1991
25.346
-0.491
-1.9%
jan 1, 1992
23.768
-1.579
-6.23%
jan 1, 1993
29.508
+5.74
24.15%
jan 1, 1994
27.683
-1.825
-6.19%
jan 1, 1995
26.624
-1.059
-3.83%
jan 1, 1996
28.342
+1.718
6.45%
jan 1, 1997
28.9
+0.559
1.97%
jan 1, 1998
28.913
+0.013
0.05%
jan 1, 2003
27.173
-1.74
-6.02%
jan 1, 2004
26.083
-1.09
-4.01%
jan 1, 2005
26.366
+0.283
1.09%
jan 1, 2006
26.735
+0.369
1.4%
jan 1, 2007
28.066
+1.33
4.98%
jan 1, 2008
26.127
-1.938
-6.91%
jan 1, 2009
23.968
-2.159
-8.26%
jan 1, 2010
20.857
-3.111
-12.98%
jan 1, 2011
19.901
-0.956
-4.58%
jan 1, 2012
20.949
+1.048
5.26%
jan 1, 2013
19.646
-1.303
-6.22%
jan 1, 2014
21.002
+1.356
6.9%
jan 1, 2015
22.021
+1.019
4.85%
jan 1, 2016
20.709
-1.312
-5.96%
Ranking of countries by current statistics by years


Comments: