29
/
en
AIzaSyAYiBZKx7MnpbEhh9jyipgxe19OcubqV5w
April 1, 2024
235830
Senegal
SEN
true
2
1
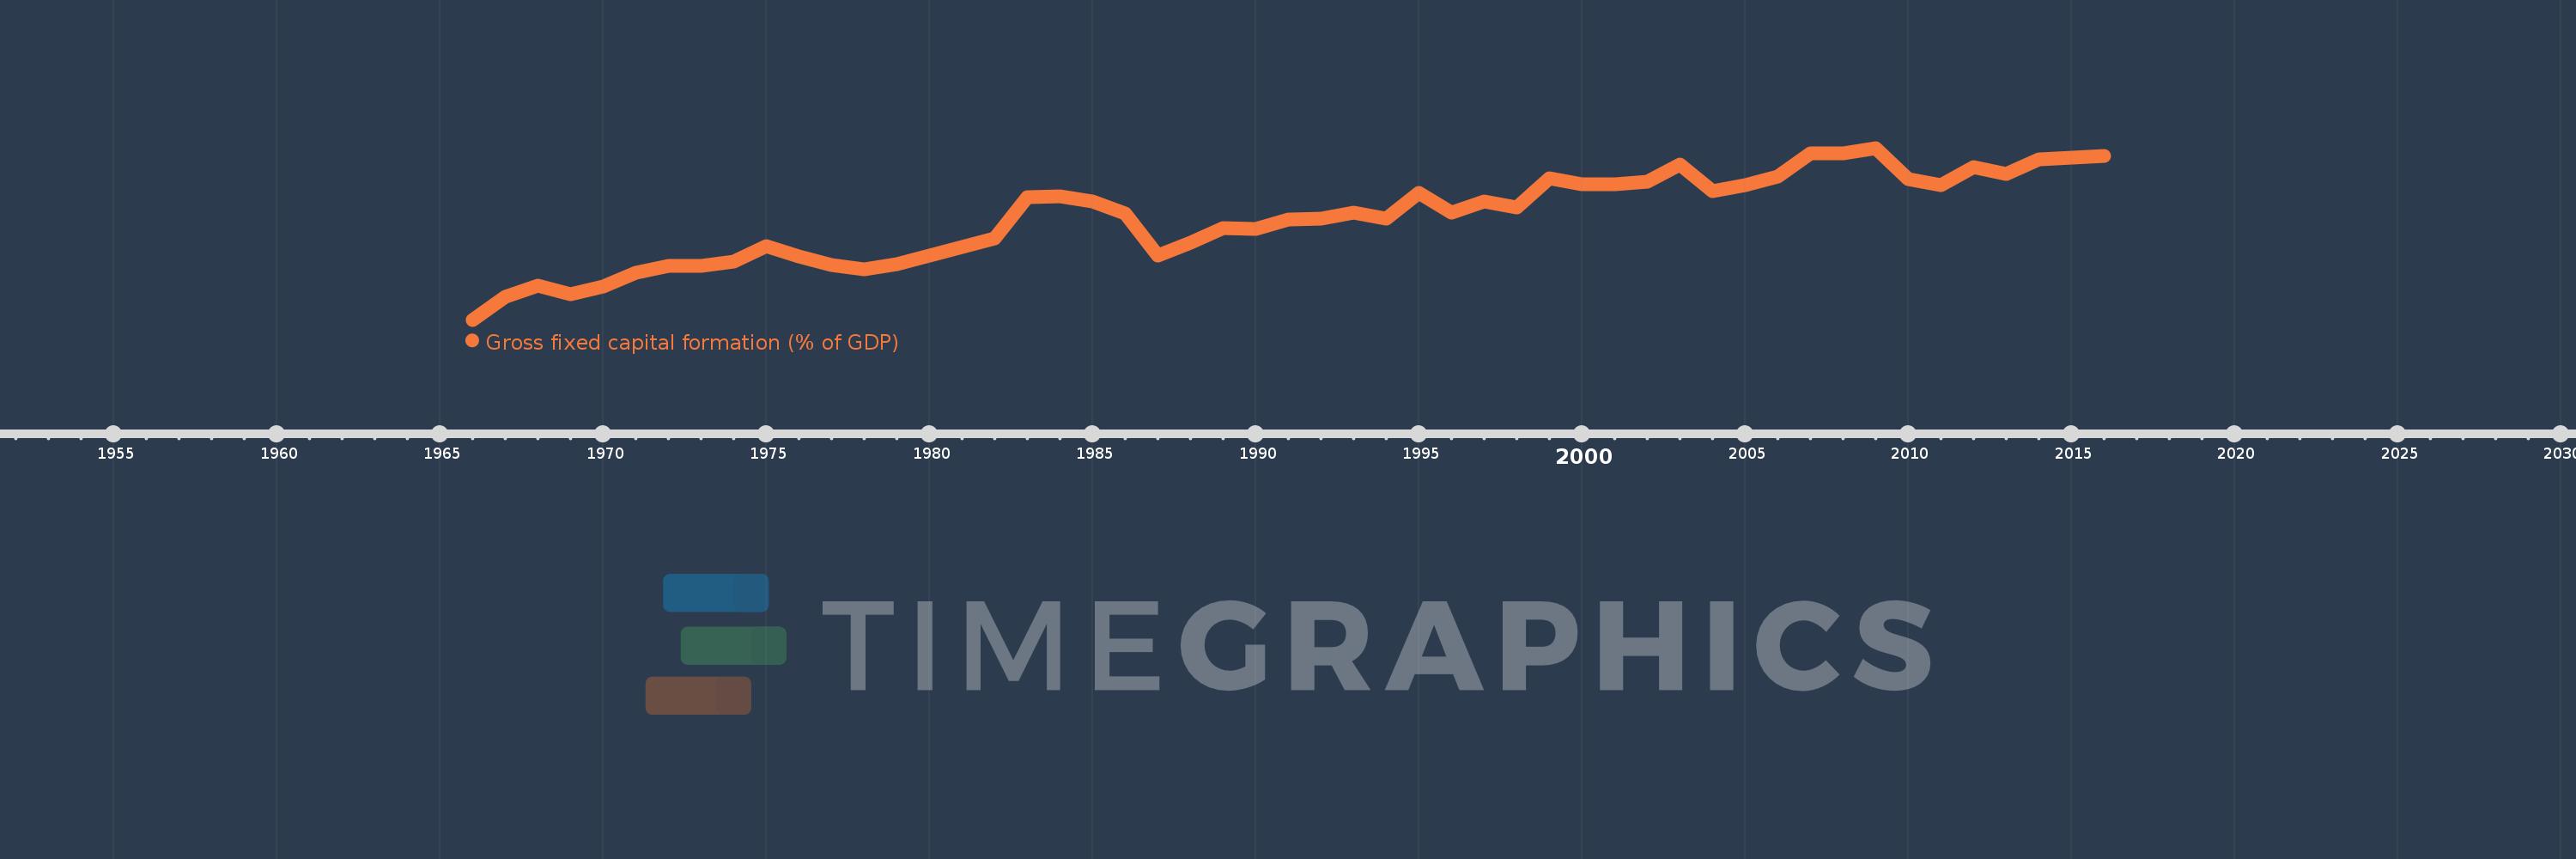
Gross fixed capital formation (% of GDP)
2016,2015,2014,2013,2012,2011,2010,2009,2008,2007,2006,2005,2004,2003,2002,2001,2000,1999,1998,1997,1996,1995,1994,1993,1992,1991,1990,1989,1988,1987,1986,1985,1984,1983,1982,1981,1980,1979,1978,1977,1976,1975,1974,1973,1972,1971,1970,1969,1968,1967,1966
This statistics in other country:
AfghanistanAlbaniaAlgeriaAngolaAntigua and BarbudaArab WorldArgentinaArmeniaArubaAustraliaAustriaAzerbaijanBahamas, TheBahrainBangladeshBarbadosBelarusBelgiumBelizeBeninBermudaBhutanBoliviaBosnia and HerzegovinaBotswanaBrazilBrunei DarussalamBulgariaBurkina FasoBurundiCabo VerdeCambodiaCameroonCanadaCaribbean small statesCentral African RepublicCentral Europe and the BalticsChadChileChinaColombiaComorosCongo, Dem. Rep.Congo, Rep.Costa RicaCote d'IvoireCroatiaCubaCyprusCzech RepublicDenmarkDjiboutiDominicaDominican RepublicEarly-demographic dividendEast Asia & PacificEast Asia & Pacific (excluding high income)East Asia & Pacific (IDA & IBRD countries)EcuadorEgypt, Arab Rep.El SalvadorEquatorial GuineaEritreaEstoniaEthiopiaEuro areaEurope & Central AsiaEurope & Central Asia (excluding high income)Europe & Central Asia (IDA & IBRD countries)European UnionFijiFinlandFragile and conflict affected situationsFranceGabonGambia, TheGeorgiaGermanyGhanaGreeceGrenadaGuatemalaGuineaGuinea-BissauGuyanaHaitiHeavily indebted poor countries (HIPC)High incomeHondurasHong Kong SAR, ChinaHungaryIBRD onlyIcelandIDA & IBRD totalIDA blendIDA onlyIDA totalIndiaIndonesiaIran, Islamic Rep.IraqIrelandIsraelItalyJamaicaJapanJordanKazakhstanKenyaKiribatiKorea, Rep.KosovoKuwaitKyrgyz RepublicLao PDRLate-demographic dividendLatin America & Caribbean Latin America & Caribbean (excluding high income)Latin America & the Caribbean (IDA & IBRD countries)LatviaLeast developed countries: UN classificationLebanonLesothoLiberiaLibyaLithuaniaLow & middle incomeLow incomeLower middle incomeLuxembourgMacao SAR, ChinaMacedonia, FYRMadagascarMalawiMalaysiaMaldivesMaliMaltaMauritaniaMauritiusMexicoMicronesia, Fed. Sts.Middle East & North AfricaMiddle East & North Africa (excluding high income)Middle East & North Africa (IDA & IBRD countries)Middle incomeMoldovaMongoliaMontenegroMoroccoMozambiqueNamibiaNepalNetherlandsNew CaledoniaNew ZealandNicaraguaNigerNigeriaNorth AmericaNorwayOECD membersOmanPacific island small statesPakistanPanamaPapua New GuineaParaguayPeruPhilippinesPolandPortugalPost-demographic dividendPre-demographic dividendPuerto RicoRomaniaRussian FederationRwandaSaudi ArabiaSenegalSerbiaSeychellesSierra LeoneSingaporeSlovak RepublicSloveniaSolomon IslandsSomaliaSouth AfricaSouth AsiaSouth Asia (IDA & IBRD)South SudanSpainSri LankaSt. Kitts and NevisSt. LuciaSt. Vincent and the GrenadinesSub-Saharan Africa Sub-Saharan Africa (excluding high income)Sub-Saharan Africa (IDA & IBRD countries)SudanSurinameSwazilandSwedenSwitzerlandSyrian Arab RepublicTajikistanTanzaniaThailandTimor-LesteTogoTongaTrinidad and TobagoTunisiaTurkeyTurkmenistanUgandaUkraineUnited Arab EmiratesUnited KingdomUnited StatesUpper middle incomeUruguayUzbekistanVanuatuVenezuela, RBVietnamWest Bank and GazaWorldYemen, Rep.ZambiaZimbabwe Timeline:
This timeline shows a graph from 1966 to 2016 of Senegal. No data until 1965. Number of actual observations by date: 51.
Source name:
World Development Indicators
Source organization:
World Bank national accounts data, and OECD National Accounts data files.
Categories, topics:
Economy & Growth
Last updated:
apr 23, 2017
Indicators value changes by year
Maximum:
26.838
jan 1, 2009
At the date of observation
Value
Absolute change
Change from previous value
jan 1, 1966
5.702
+5.702
0.0%
jan 1, 1967
8.524
+2.822
49.5%
jan 1, 1968
9.926
+1.402
16.45%
jan 1, 1969
8.803
-1.123
-11.31%
jan 1, 1970
9.83
+1.027
11.67%
jan 1, 1971
11.451
+1.62
16.48%
jan 1, 1972
12.333
+0.883
7.71%
jan 1, 1973
12.376
+0.043
0.35%
jan 1, 1974
12.864
+0.488
3.94%
jan 1, 1975
14.718
+1.854
14.41%
jan 1, 1976
13.519
-1.199
-8.15%
jan 1, 1977
12.419
-1.1
-8.14%
jan 1, 1978
11.957
-0.462
-3.72%
jan 1, 1979
12.592
+0.635
5.31%
jan 1, 1980
13.614
+1.022
8.12%
jan 1, 1981
14.636
+1.022
7.51%
jan 1, 1982
15.672
+1.036
7.08%
jan 1, 1983
20.816
+5.144
32.82%
jan 1, 1984
20.905
+0.088
0.42%
jan 1, 1985
20.301
-0.603
-2.89%
jan 1, 1986
18.821
-1.481
-7.29%
jan 1, 1987
13.562
-5.258
-27.94%
jan 1, 1988
15.218
+1.656
12.21%
jan 1, 1989
17.03
+1.812
11.9%
jan 1, 1990
16.833
-0.197
-1.16%
jan 1, 1991
17.993
+1.16
6.89%
jan 1, 1992
18.09
+0.096
0.53%
jan 1, 1993
18.893
+0.803
4.44%
jan 1, 1994
18.164
-0.729
-3.86%
jan 1, 1995
21.318
+3.154
17.36%
jan 1, 1996
18.929
-2.39
-11.21%
jan 1, 1997
20.247
+1.319
6.97%
jan 1, 1998
19.494
-0.754
-3.72%
jan 1, 1999
23.121
+3.627
18.6%
jan 1, 2000
22.372
-0.748
-3.24%
jan 1, 2001
22.395
+0.022
0.1%
jan 1, 2002
22.725
+0.33
1.47%
jan 1, 2003
24.82
+2.095
9.22%
jan 1, 2004
21.513
-3.307
-13.32%
jan 1, 2005
22.251
+0.738
3.43%
jan 1, 2006
23.328
+1.077
4.84%
jan 1, 2007
26.151
+2.824
12.1%
jan 1, 2008
26.146
-0.005
-0.02%
jan 1, 2009
26.838
+0.692
2.65%
jan 1, 2010
22.986
-3.853
-14.35%
jan 1, 2011
22.224
-0.762
-3.31%
jan 1, 2012
24.512
+2.288
10.29%
jan 1, 2013
23.593
-0.919
-3.75%
jan 1, 2014
25.438
+1.845
7.82%
jan 1, 2015
25.617
+0.179
0.7%
jan 1, 2016
25.819
+0.202
0.79%
Ranking of countries by current statistics by years


Comments: