29
/
en
AIzaSyAYiBZKx7MnpbEhh9jyipgxe19OcubqV5w
April 1, 2024
251939
St. Vincent and the Grenadines
VCT
true
2
1
Gross fixed capital formation (% of GDP)
2016,2015,2014,2013,2012,2011,2010,2009,2008,2007,2006,2005,2004,2003,2002,2001,2000,1999,1998,1997,1996,1995,1994,1993,1992,1991,1990,1989,1988,1987,1986,1985,1984,1983,1982,1981,1980,1979,1978
This statistics in other country:
AfghanistanAlbaniaAlgeriaAngolaAntigua and BarbudaArab WorldArgentinaArmeniaArubaAustraliaAustriaAzerbaijanBahamas, TheBahrainBangladeshBarbadosBelarusBelgiumBelizeBeninBermudaBhutanBoliviaBosnia and HerzegovinaBotswanaBrazilBrunei DarussalamBulgariaBurkina FasoBurundiCabo VerdeCambodiaCameroonCanadaCaribbean small statesCentral African RepublicCentral Europe and the BalticsChadChileChinaColombiaComorosCongo, Dem. Rep.Congo, Rep.Costa RicaCote d'IvoireCroatiaCubaCyprusCzech RepublicDenmarkDjiboutiDominicaDominican RepublicEarly-demographic dividendEast Asia & PacificEast Asia & Pacific (excluding high income)East Asia & Pacific (IDA & IBRD countries)EcuadorEgypt, Arab Rep.El SalvadorEquatorial GuineaEritreaEstoniaEthiopiaEuro areaEurope & Central AsiaEurope & Central Asia (excluding high income)Europe & Central Asia (IDA & IBRD countries)European UnionFijiFinlandFragile and conflict affected situationsFranceGabonGambia, TheGeorgiaGermanyGhanaGreeceGrenadaGuatemalaGuineaGuinea-BissauGuyanaHaitiHeavily indebted poor countries (HIPC)High incomeHondurasHong Kong SAR, ChinaHungaryIBRD onlyIcelandIDA & IBRD totalIDA blendIDA onlyIDA totalIndiaIndonesiaIran, Islamic Rep.IraqIrelandIsraelItalyJamaicaJapanJordanKazakhstanKenyaKiribatiKorea, Rep.KosovoKuwaitKyrgyz RepublicLao PDRLate-demographic dividendLatin America & Caribbean Latin America & Caribbean (excluding high income)Latin America & the Caribbean (IDA & IBRD countries)LatviaLeast developed countries: UN classificationLebanonLesothoLiberiaLibyaLithuaniaLow & middle incomeLow incomeLower middle incomeLuxembourgMacao SAR, ChinaMacedonia, FYRMadagascarMalawiMalaysiaMaldivesMaliMaltaMauritaniaMauritiusMexicoMicronesia, Fed. Sts.Middle East & North AfricaMiddle East & North Africa (excluding high income)Middle East & North Africa (IDA & IBRD countries)Middle incomeMoldovaMongoliaMontenegroMoroccoMozambiqueNamibiaNepalNetherlandsNew CaledoniaNew ZealandNicaraguaNigerNigeriaNorth AmericaNorwayOECD membersOmanPacific island small statesPakistanPanamaPapua New GuineaParaguayPeruPhilippinesPolandPortugalPost-demographic dividendPre-demographic dividendPuerto RicoRomaniaRussian FederationRwandaSaudi ArabiaSenegalSerbiaSeychellesSierra LeoneSingaporeSlovak RepublicSloveniaSolomon IslandsSomaliaSouth AfricaSouth AsiaSouth Asia (IDA & IBRD)South SudanSpainSri LankaSt. Kitts and NevisSt. LuciaSt. Vincent and the GrenadinesSub-Saharan Africa Sub-Saharan Africa (excluding high income)Sub-Saharan Africa (IDA & IBRD countries)SudanSurinameSwazilandSwedenSwitzerlandSyrian Arab RepublicTajikistanTanzaniaThailandTimor-LesteTogoTongaTrinidad and TobagoTunisiaTurkeyTurkmenistanUgandaUkraineUnited Arab EmiratesUnited KingdomUnited StatesUpper middle incomeUruguayUzbekistanVanuatuVenezuela, RBVietnamWest Bank and GazaWorldYemen, Rep.ZambiaZimbabwe Timeline:
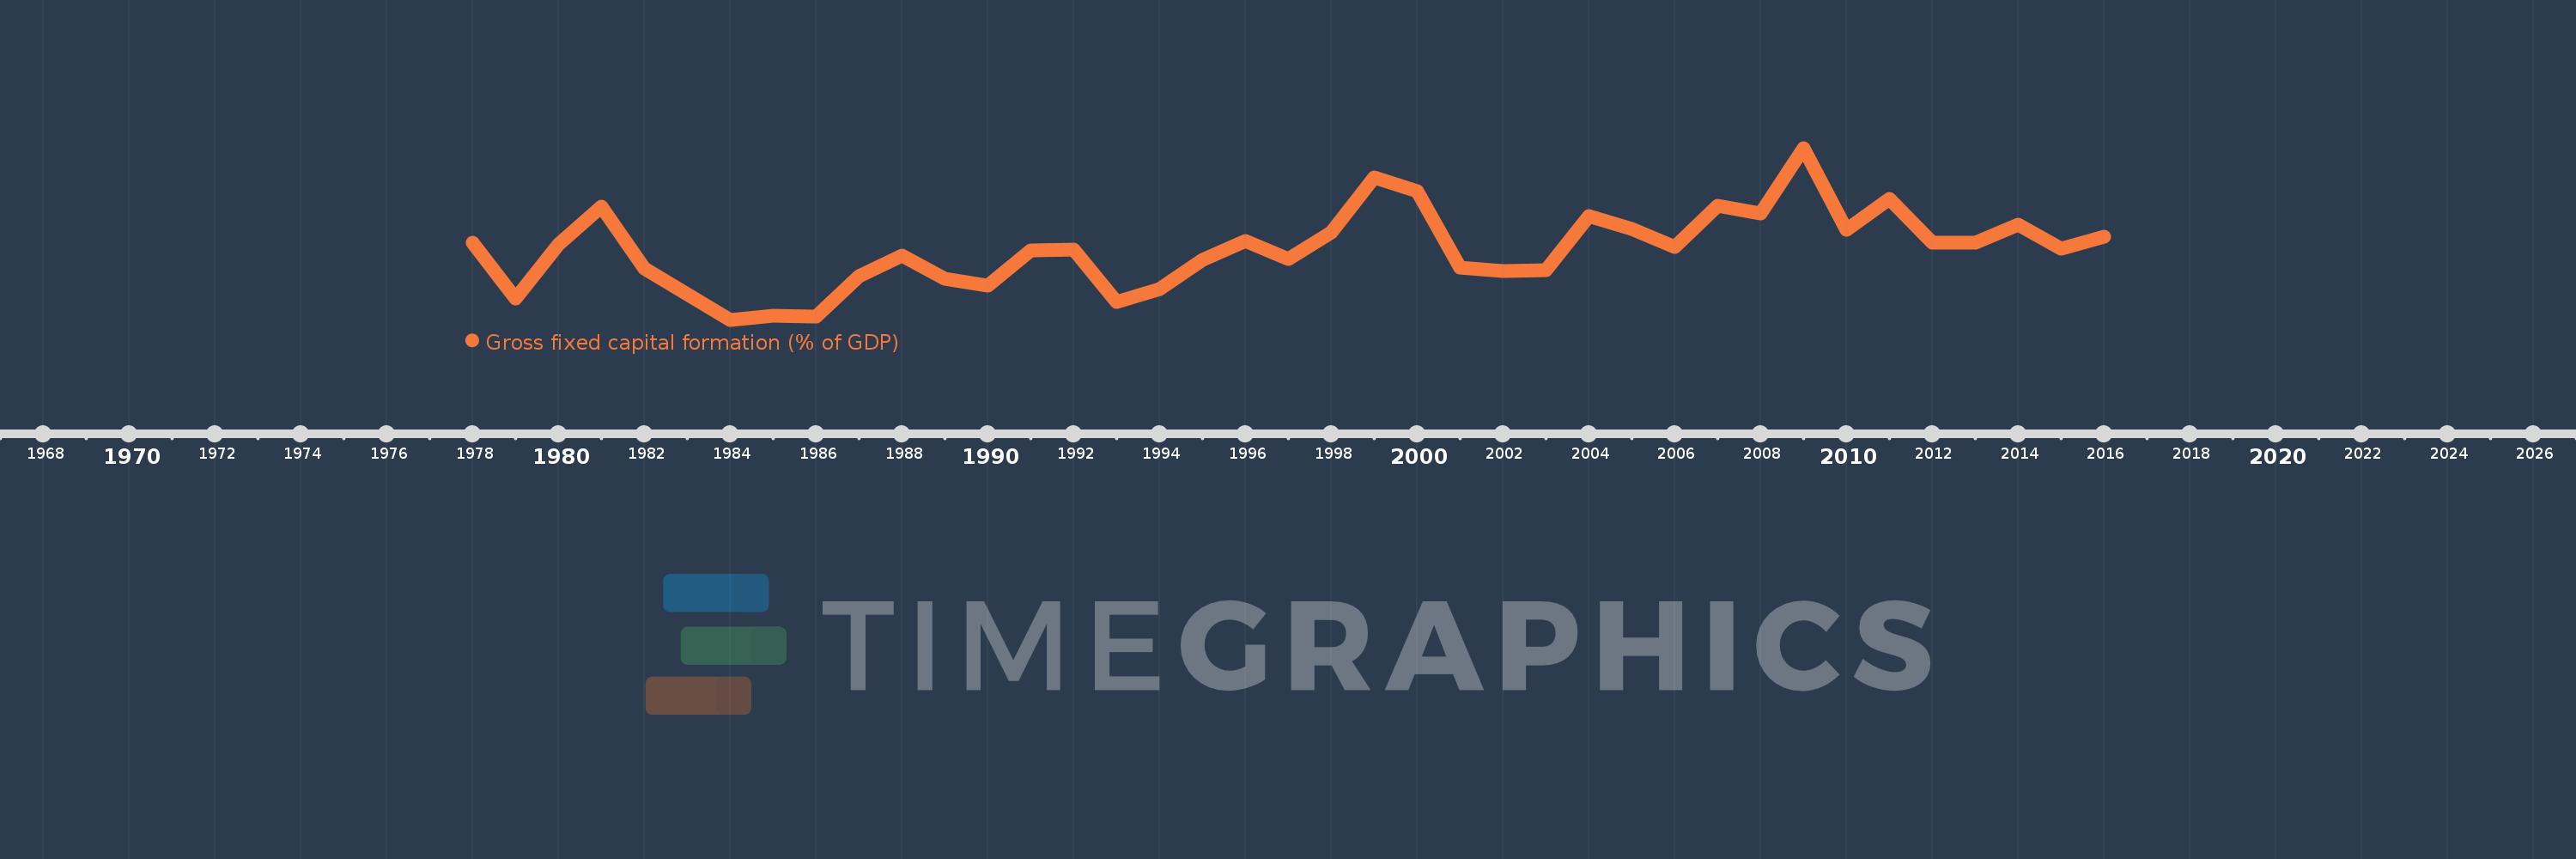
This timeline shows a graph from 1978 to 2016 of St. Vincent and the Grenadines. No data until 1977. Number of actual observations by date: 39.
Source name:
World Development Indicators
Source organization:
World Bank national accounts data, and OECD National Accounts data files.
Categories, topics:
Economy & Growth
Last updated:
apr 23, 2017
Indicators value changes by year
Minimum:
19.196
jan 1, 1984
Maximum:
33.148
jan 1, 2009
At the date of observation
Value
Absolute change
Change from previous value
jan 1, 1978
25.425
+25.425
0.0%
jan 1, 1979
20.921
-4.504
-17.71%
jan 1, 1980
25.328
+4.407
21.06%
jan 1, 1981
28.373
+3.045
12.02%
jan 1, 1982
23.363
-5.01
-17.66%
jan 1, 1983
21.246
-2.117
-9.06%
jan 1, 1984
19.196
-2.051
-9.65%
jan 1, 1985
19.496
+0.3
1.57%
jan 1, 1986
19.485
-0.011
-0.06%
jan 1, 1987
22.738
+3.253
16.7%
jan 1, 1988
24.397
+1.658
7.29%
jan 1, 1989
22.532
-1.865
-7.64%
jan 1, 1990
21.94
-0.591
-2.63%
jan 1, 1991
24.845
+2.905
13.24%
jan 1, 1992
24.886
+0.041
0.16%
jan 1, 1993
20.634
-4.252
-17.08%
jan 1, 1994
21.676
+1.042
5.05%
jan 1, 1995
24.048
+2.371
10.94%
jan 1, 1996
25.595
+1.547
6.43%
jan 1, 1997
24.1
-1.494
-5.84%
jan 1, 1998
26.322
+2.222
9.22%
jan 1, 1999
30.768
+4.446
16.89%
jan 1, 2000
29.631
-1.137
-3.7%
jan 1, 2001
23.409
-6.222
-21.0%
jan 1, 2002
23.155
-0.254
-1.08%
jan 1, 2003
23.245
+0.09
0.39%
jan 1, 2004
27.6
+4.354
18.73%
jan 1, 2005
26.579
-1.021
-3.7%
jan 1, 2006
25.075
-1.505
-5.66%
jan 1, 2007
28.474
+3.399
13.56%
jan 1, 2008
27.842
-0.632
-2.22%
jan 1, 2009
33.148
+5.306
19.06%
jan 1, 2010
26.501
-6.647
-20.05%
jan 1, 2011
28.988
+2.487
9.38%
jan 1, 2012
25.434
-3.554
-12.26%
jan 1, 2013
25.427
-0.007
-0.03%
jan 1, 2014
26.899
+1.472
5.79%
jan 1, 2015
24.992
-1.907
-7.09%
jan 1, 2016
25.937
+0.945
3.78%
Ranking of countries by current statistics by years


Comments: