29
/
en
AIzaSyAYiBZKx7MnpbEhh9jyipgxe19OcubqV5w
April 1, 2024
240506
Singapore
SGP
true
2
1
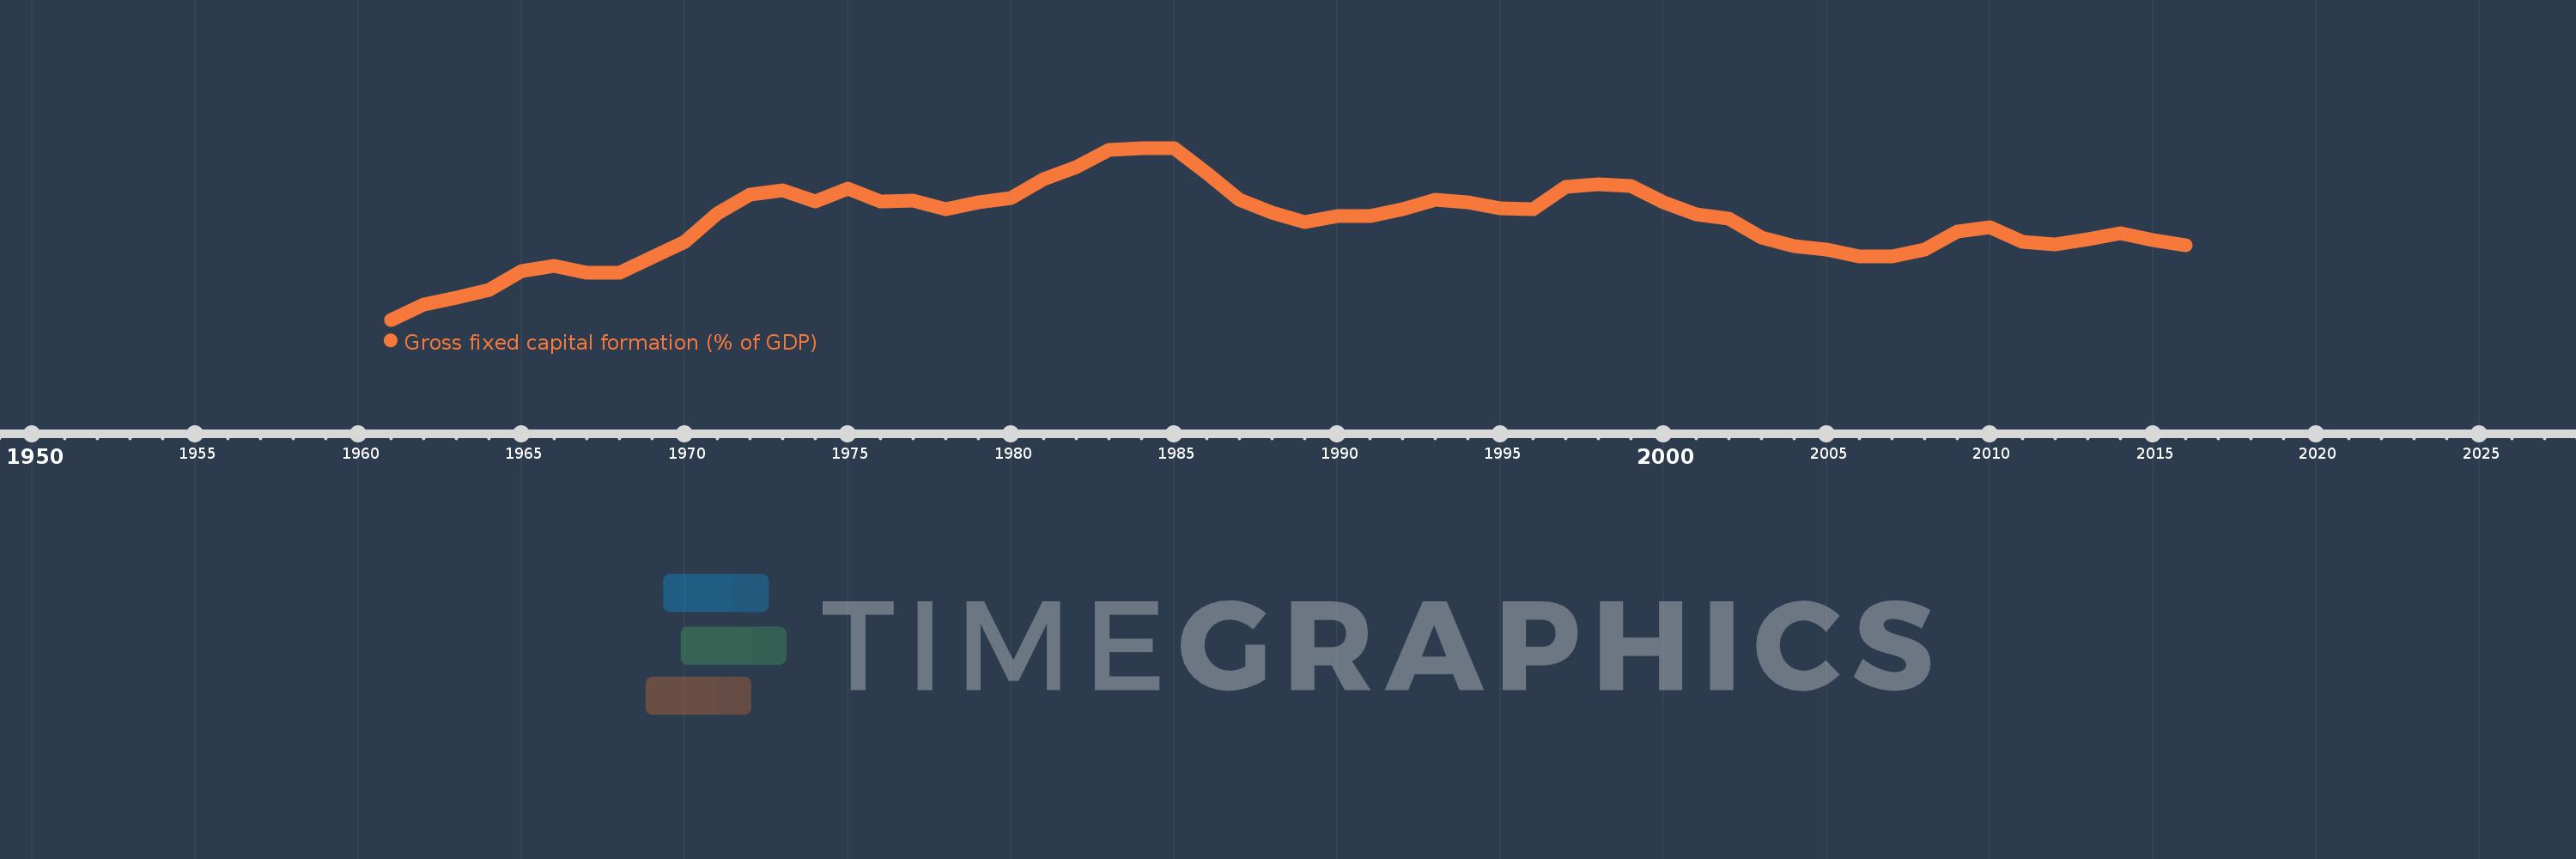
Gross fixed capital formation (% of GDP)
2016,2015,2014,2013,2012,2011,2010,2009,2008,2007,2006,2005,2004,2003,2002,2001,2000,1999,1998,1997,1996,1995,1994,1993,1992,1991,1990,1989,1988,1987,1986,1985,1984,1983,1982,1981,1980,1979,1978,1977,1976,1975,1974,1973,1972,1971,1970,1969,1968,1967,1966,1965,1964,1963,1962,1961
This statistics in other country:
AfghanistanAlbaniaAlgeriaAngolaAntigua and BarbudaArab WorldArgentinaArmeniaArubaAustraliaAustriaAzerbaijanBahamas, TheBahrainBangladeshBarbadosBelarusBelgiumBelizeBeninBermudaBhutanBoliviaBosnia and HerzegovinaBotswanaBrazilBrunei DarussalamBulgariaBurkina FasoBurundiCabo VerdeCambodiaCameroonCanadaCaribbean small statesCentral African RepublicCentral Europe and the BalticsChadChileChinaColombiaComorosCongo, Dem. Rep.Congo, Rep.Costa RicaCote d'IvoireCroatiaCubaCyprusCzech RepublicDenmarkDjiboutiDominicaDominican RepublicEarly-demographic dividendEast Asia & PacificEast Asia & Pacific (excluding high income)East Asia & Pacific (IDA & IBRD countries)EcuadorEgypt, Arab Rep.El SalvadorEquatorial GuineaEritreaEstoniaEthiopiaEuro areaEurope & Central AsiaEurope & Central Asia (excluding high income)Europe & Central Asia (IDA & IBRD countries)European UnionFijiFinlandFragile and conflict affected situationsFranceGabonGambia, TheGeorgiaGermanyGhanaGreeceGrenadaGuatemalaGuineaGuinea-BissauGuyanaHaitiHeavily indebted poor countries (HIPC)High incomeHondurasHong Kong SAR, ChinaHungaryIBRD onlyIcelandIDA & IBRD totalIDA blendIDA onlyIDA totalIndiaIndonesiaIran, Islamic Rep.IraqIrelandIsraelItalyJamaicaJapanJordanKazakhstanKenyaKiribatiKorea, Rep.KosovoKuwaitKyrgyz RepublicLao PDRLate-demographic dividendLatin America & Caribbean Latin America & Caribbean (excluding high income)Latin America & the Caribbean (IDA & IBRD countries)LatviaLeast developed countries: UN classificationLebanonLesothoLiberiaLibyaLithuaniaLow & middle incomeLow incomeLower middle incomeLuxembourgMacao SAR, ChinaMacedonia, FYRMadagascarMalawiMalaysiaMaldivesMaliMaltaMauritaniaMauritiusMexicoMicronesia, Fed. Sts.Middle East & North AfricaMiddle East & North Africa (excluding high income)Middle East & North Africa (IDA & IBRD countries)Middle incomeMoldovaMongoliaMontenegroMoroccoMozambiqueNamibiaNepalNetherlandsNew CaledoniaNew ZealandNicaraguaNigerNigeriaNorth AmericaNorwayOECD membersOmanPacific island small statesPakistanPanamaPapua New GuineaParaguayPeruPhilippinesPolandPortugalPost-demographic dividendPre-demographic dividendPuerto RicoRomaniaRussian FederationRwandaSaudi ArabiaSenegalSerbiaSeychellesSierra LeoneSingaporeSlovak RepublicSloveniaSolomon IslandsSomaliaSouth AfricaSouth AsiaSouth Asia (IDA & IBRD)South SudanSpainSri LankaSt. Kitts and NevisSt. LuciaSt. Vincent and the GrenadinesSub-Saharan Africa Sub-Saharan Africa (excluding high income)Sub-Saharan Africa (IDA & IBRD countries)SudanSurinameSwazilandSwedenSwitzerlandSyrian Arab RepublicTajikistanTanzaniaThailandTimor-LesteTogoTongaTrinidad and TobagoTunisiaTurkeyTurkmenistanUgandaUkraineUnited Arab EmiratesUnited KingdomUnited StatesUpper middle incomeUruguayUzbekistanVanuatuVenezuela, RBVietnamWest Bank and GazaWorldYemen, Rep.ZambiaZimbabwe Timeline:
This timeline shows a graph from 1961 to 2016 of Singapore. No data until 1960. Number of actual observations by date: 56.
Source name:
World Development Indicators
Source organization:
World Bank national accounts data, and OECD National Accounts data files.
Categories, topics:
Economy & Growth
Last updated:
apr 23, 2017
Indicators value changes by year
Maximum:
46.247
jan 1, 1985
At the date of observation
Value
Absolute change
Change from previous value
jan 1, 1961
9.502
+9.502
0.0%
jan 1, 1962
12.707
+3.205
33.73%
jan 1, 1963
14.22
+1.513
11.91%
jan 1, 1964
15.888
+1.668
11.73%
jan 1, 1965
19.997
+4.109
25.86%
jan 1, 1966
20.958
+0.961
4.8%
jan 1, 1967
19.533
-1.424
-6.8%
jan 1, 1968
19.483
-0.051
-0.26%
jan 1, 1969
22.85
+3.368
17.29%
jan 1, 1970
26.103
+3.253
14.24%
jan 1, 1971
32.139
+6.036
23.12%
jan 1, 1972
36.202
+4.063
12.64%
jan 1, 1973
37.271
+1.069
2.95%
jan 1, 1974
34.714
-2.557
-6.86%
jan 1, 1975
37.541
+2.827
8.14%
jan 1, 1976
34.889
-2.652
-7.06%
jan 1, 1977
34.971
+0.082
0.24%
jan 1, 1978
33.155
-1.816
-5.19%
jan 1, 1979
34.631
+1.476
4.45%
jan 1, 1980
35.591
+0.96
2.77%
jan 1, 1981
39.526
+3.934
11.05%
jan 1, 1982
42.145
+2.619
6.63%
jan 1, 1983
45.83
+3.685
8.74%
jan 1, 1984
46.123
+0.293
0.64%
jan 1, 1985
46.247
+0.124
0.27%
jan 1, 1986
40.824
-5.423
-11.73%
jan 1, 1987
35.156
-5.668
-13.88%
jan 1, 1988
32.391
-2.766
-7.87%
jan 1, 1989
30.331
-2.06
-6.36%
jan 1, 1990
31.719
+1.388
4.58%
jan 1, 1991
31.71
-0.008
-0.03%
jan 1, 1992
33.134
+1.423
4.49%
jan 1, 1993
35.175
+2.042
6.16%
jan 1, 1994
34.615
-0.561
-1.59%
jan 1, 1995
33.309
-1.306
-3.77%
jan 1, 1996
33.146
-0.163
-0.49%
jan 1, 1997
37.855
+4.708
14.21%
jan 1, 1998
38.467
+0.612
1.62%
jan 1, 1999
38.097
-0.37
-0.96%
jan 1, 2000
34.585
-3.512
-9.22%
jan 1, 2001
32.044
-2.542
-7.35%
jan 1, 2002
31.057
-0.987
-3.08%
jan 1, 2003
27.168
-3.888
-12.52%
jan 1, 2004
25.254
-1.915
-7.05%
jan 1, 2005
24.523
-0.731
-2.89%
jan 1, 2006
23.075
-1.448
-5.9%
jan 1, 2007
23.061
-0.014
-0.06%
jan 1, 2008
24.481
+1.421
6.16%
jan 1, 2009
28.338
+3.856
15.75%
jan 1, 2010
29.271
+0.933
3.29%
jan 1, 2011
26.127
-3.144
-10.74%
jan 1, 2012
25.566
-0.562
-2.15%
jan 1, 2013
26.763
+1.197
4.68%
jan 1, 2014
27.923
+1.161
4.34%
jan 1, 2015
26.548
-1.376
-4.93%
jan 1, 2016
25.511
-1.037
-3.91%
Ranking of countries by current statistics by years


Comments: