29
/
en
AIzaSyAYiBZKx7MnpbEhh9jyipgxe19OcubqV5w
April 1, 2024
265818
Tonga
TON
true
2
1
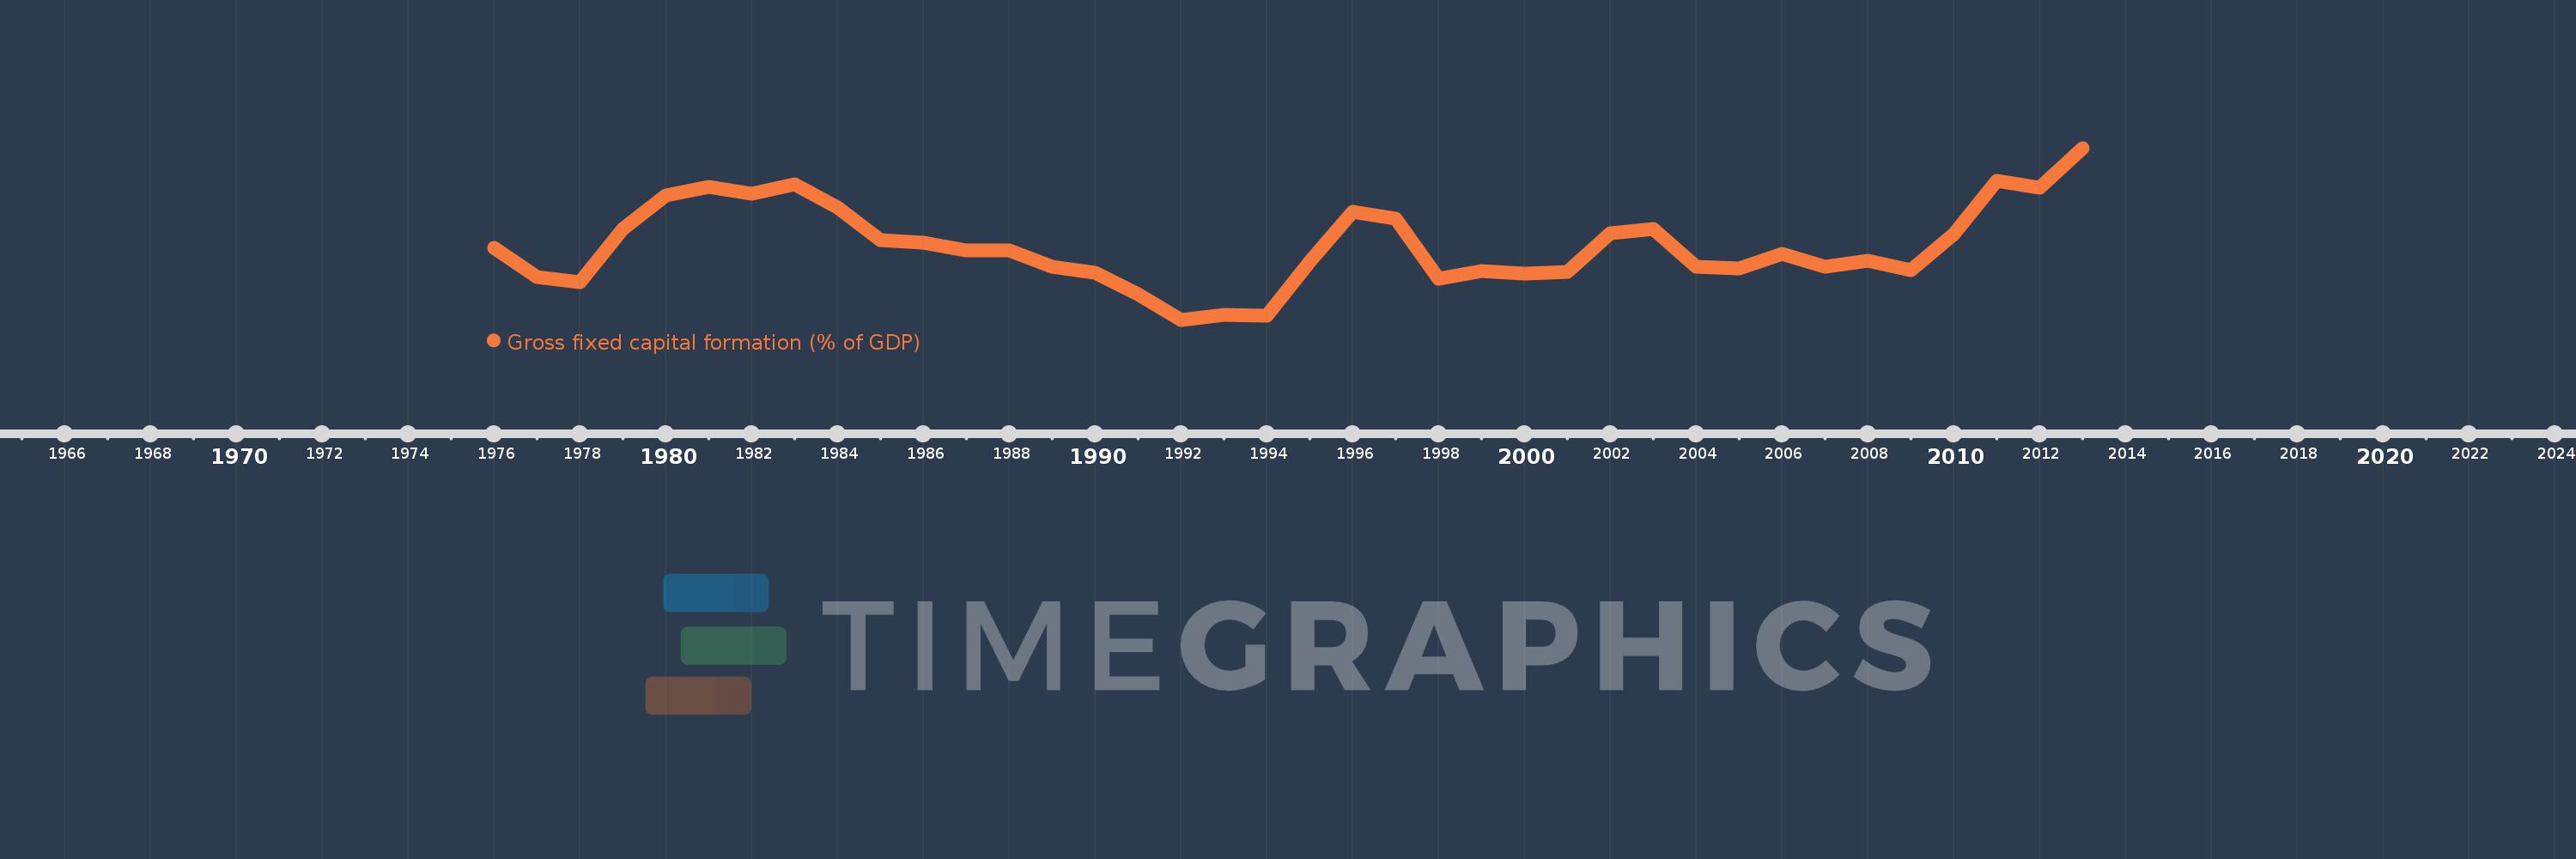
Gross fixed capital formation (% of GDP)
2013,2012,2011,2010,2009,2008,2007,2006,2005,2004,2003,2002,2001,2000,1999,1998,1997,1996,1995,1994,1993,1992,1991,1990,1989,1988,1987,1986,1985,1984,1983,1982,1981,1980,1979,1978,1977,1976
This statistics in other country:
AfghanistanAlbaniaAlgeriaAngolaAntigua and BarbudaArab WorldArgentinaArmeniaArubaAustraliaAustriaAzerbaijanBahamas, TheBahrainBangladeshBarbadosBelarusBelgiumBelizeBeninBermudaBhutanBoliviaBosnia and HerzegovinaBotswanaBrazilBrunei DarussalamBulgariaBurkina FasoBurundiCabo VerdeCambodiaCameroonCanadaCaribbean small statesCentral African RepublicCentral Europe and the BalticsChadChileChinaColombiaComorosCongo, Dem. Rep.Congo, Rep.Costa RicaCote d'IvoireCroatiaCubaCyprusCzech RepublicDenmarkDjiboutiDominicaDominican RepublicEarly-demographic dividendEast Asia & PacificEast Asia & Pacific (excluding high income)East Asia & Pacific (IDA & IBRD countries)EcuadorEgypt, Arab Rep.El SalvadorEquatorial GuineaEritreaEstoniaEthiopiaEuro areaEurope & Central AsiaEurope & Central Asia (excluding high income)Europe & Central Asia (IDA & IBRD countries)European UnionFijiFinlandFragile and conflict affected situationsFranceGabonGambia, TheGeorgiaGermanyGhanaGreeceGrenadaGuatemalaGuineaGuinea-BissauGuyanaHaitiHeavily indebted poor countries (HIPC)High incomeHondurasHong Kong SAR, ChinaHungaryIBRD onlyIcelandIDA & IBRD totalIDA blendIDA onlyIDA totalIndiaIndonesiaIran, Islamic Rep.IraqIrelandIsraelItalyJamaicaJapanJordanKazakhstanKenyaKiribatiKorea, Rep.KosovoKuwaitKyrgyz RepublicLao PDRLate-demographic dividendLatin America & Caribbean Latin America & Caribbean (excluding high income)Latin America & the Caribbean (IDA & IBRD countries)LatviaLeast developed countries: UN classificationLebanonLesothoLiberiaLibyaLithuaniaLow & middle incomeLow incomeLower middle incomeLuxembourgMacao SAR, ChinaMacedonia, FYRMadagascarMalawiMalaysiaMaldivesMaliMaltaMauritaniaMauritiusMexicoMicronesia, Fed. Sts.Middle East & North AfricaMiddle East & North Africa (excluding high income)Middle East & North Africa (IDA & IBRD countries)Middle incomeMoldovaMongoliaMontenegroMoroccoMozambiqueNamibiaNepalNetherlandsNew CaledoniaNew ZealandNicaraguaNigerNigeriaNorth AmericaNorwayOECD membersOmanPacific island small statesPakistanPanamaPapua New GuineaParaguayPeruPhilippinesPolandPortugalPost-demographic dividendPre-demographic dividendPuerto RicoRomaniaRussian FederationRwandaSaudi ArabiaSenegalSerbiaSeychellesSierra LeoneSingaporeSlovak RepublicSloveniaSolomon IslandsSomaliaSouth AfricaSouth AsiaSouth Asia (IDA & IBRD)South SudanSpainSri LankaSt. Kitts and NevisSt. LuciaSt. Vincent and the GrenadinesSub-Saharan Africa Sub-Saharan Africa (excluding high income)Sub-Saharan Africa (IDA & IBRD countries)SudanSurinameSwazilandSwedenSwitzerlandSyrian Arab RepublicTajikistanTanzaniaThailandTimor-LesteTogoTongaTrinidad and TobagoTunisiaTurkeyTurkmenistanUgandaUkraineUnited Arab EmiratesUnited KingdomUnited StatesUpper middle incomeUruguayUzbekistanVanuatuVenezuela, RBVietnamWest Bank and GazaWorldYemen, Rep.ZambiaZimbabwe Timeline:
This timeline shows a graph from 1976 to 2013 of Tonga. No data until 1975. Number of actual observations by date: 38.
Source name:
World Development Indicators
Source organization:
World Bank national accounts data, and OECD National Accounts data files.
Categories, topics:
Economy & Growth
Last updated:
apr 23, 2017
Indicators value changes by year
Minimum:
15.356
jan 1, 1992
Maximum:
33.009
jan 1, 2013
At the date of observation
Value
Absolute change
Change from previous value
jan 1, 1976
22.782
+22.782
0.0%
jan 1, 1977
19.785
-2.997
-13.16%
jan 1, 1978
19.174
-0.611
-3.09%
jan 1, 1979
24.681
+5.506
28.72%
jan 1, 1980
28.12
+3.439
13.93%
jan 1, 1981
29.038
+0.918
3.27%
jan 1, 1982
28.307
-0.731
-2.52%
jan 1, 1983
29.315
+1.008
3.56%
jan 1, 1984
26.896
-2.419
-8.25%
jan 1, 1985
23.542
-3.355
-12.47%
jan 1, 1986
23.261
-0.281
-1.19%
jan 1, 1987
22.51
-0.751
-3.23%
jan 1, 1988
22.473
-0.037
-0.16%
jan 1, 1989
20.834
-1.639
-7.29%
jan 1, 1990
20.206
-0.628
-3.01%
jan 1, 1991
18.011
-2.195
-10.86%
jan 1, 1992
15.356
-2.655
-14.74%
jan 1, 1993
15.832
+0.476
3.1%
jan 1, 1994
15.811
-0.021
-0.13%
jan 1, 1995
21.365
+5.554
35.13%
jan 1, 1996
26.472
+5.107
23.9%
jan 1, 1997
25.783
-0.688
-2.6%
jan 1, 1998
19.524
-6.259
-24.28%
jan 1, 1999
20.367
+0.842
4.31%
jan 1, 2000
20.116
-0.25
-1.23%
jan 1, 2001
20.231
+0.115
0.57%
jan 1, 2002
24.203
+3.972
19.63%
jan 1, 2003
24.666
+0.463
1.91%
jan 1, 2004
20.82
-3.846
-15.59%
jan 1, 2005
20.661
-0.159
-0.76%
jan 1, 2006
22.111
+1.45
7.02%
jan 1, 2007
20.811
-1.3
-5.88%
jan 1, 2008
21.416
+0.604
2.9%
jan 1, 2009
20.483
-0.933
-4.36%
jan 1, 2010
24.179
+3.697
18.05%
jan 1, 2011
29.6
+5.421
22.42%
jan 1, 2012
28.901
-0.7
-2.36%
jan 1, 2013
33.009
+4.108
14.21%
Ranking of countries by current statistics by years


Comments: