29
/
en
AIzaSyAYiBZKx7MnpbEhh9jyipgxe19OcubqV5w
April 1, 2024
35781
High income
HIC
false
2
1
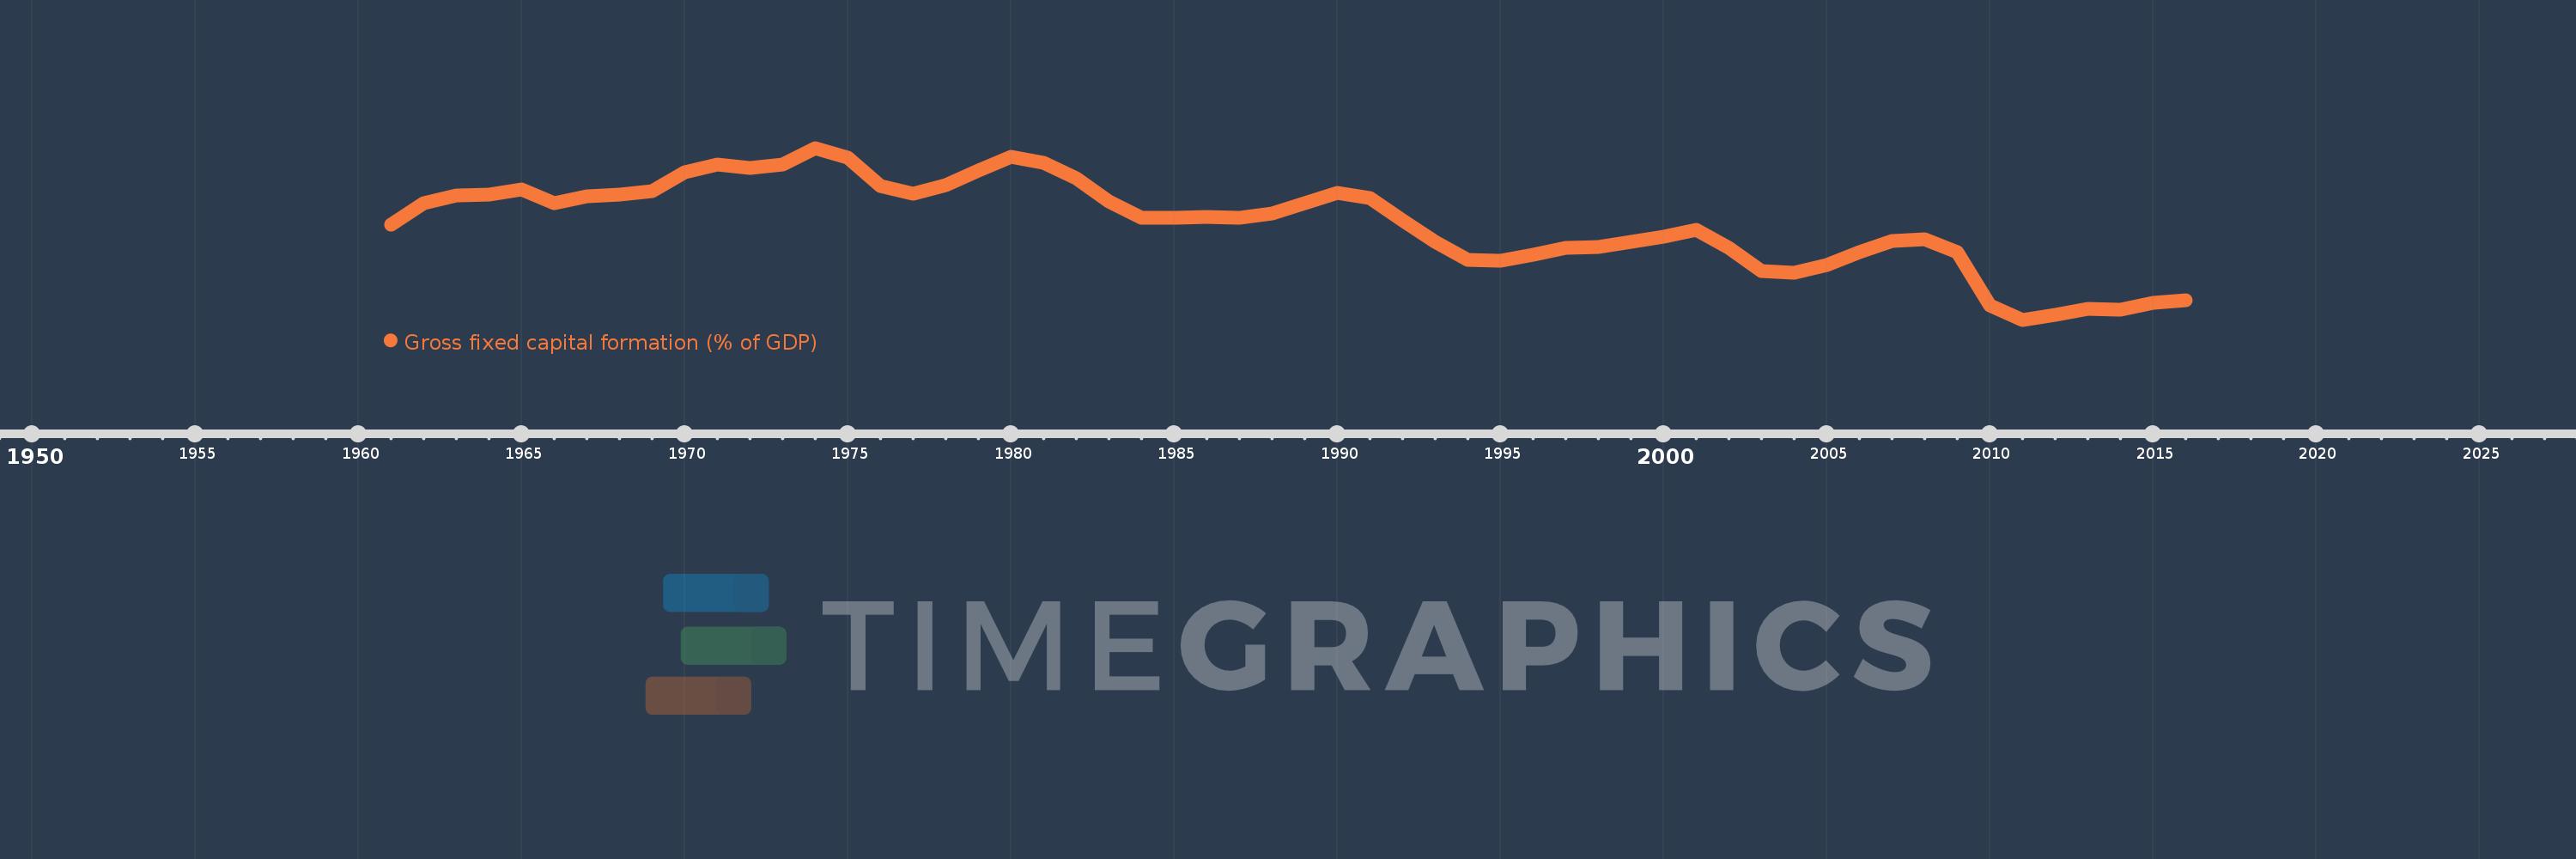
Gross fixed capital formation (% of GDP)
2016,2015,2014,2013,2012,2011,2010,2009,2008,2007,2006,2005,2004,2003,2002,2001,2000,1999,1998,1997,1996,1995,1994,1993,1992,1991,1990,1989,1988,1987,1986,1985,1984,1983,1982,1981,1980,1979,1978,1977,1976,1975,1974,1973,1972,1971,1970,1969,1968,1967,1966,1965,1964,1963,1962,1961
This statistics in other country:
AfghanistanAlbaniaAlgeriaAngolaAntigua and BarbudaArab WorldArgentinaArmeniaArubaAustraliaAustriaAzerbaijanBahamas, TheBahrainBangladeshBarbadosBelarusBelgiumBelizeBeninBermudaBhutanBoliviaBosnia and HerzegovinaBotswanaBrazilBrunei DarussalamBulgariaBurkina FasoBurundiCabo VerdeCambodiaCameroonCanadaCaribbean small statesCentral African RepublicCentral Europe and the BalticsChadChileChinaColombiaComorosCongo, Dem. Rep.Congo, Rep.Costa RicaCote d'IvoireCroatiaCubaCyprusCzech RepublicDenmarkDjiboutiDominicaDominican RepublicEarly-demographic dividendEast Asia & PacificEast Asia & Pacific (excluding high income)East Asia & Pacific (IDA & IBRD countries)EcuadorEgypt, Arab Rep.El SalvadorEquatorial GuineaEritreaEstoniaEthiopiaEuro areaEurope & Central AsiaEurope & Central Asia (excluding high income)Europe & Central Asia (IDA & IBRD countries)European UnionFijiFinlandFragile and conflict affected situationsFranceGabonGambia, TheGeorgiaGermanyGhanaGreeceGrenadaGuatemalaGuineaGuinea-BissauGuyanaHaitiHeavily indebted poor countries (HIPC)High incomeHondurasHong Kong SAR, ChinaHungaryIBRD onlyIcelandIDA & IBRD totalIDA blendIDA onlyIDA totalIndiaIndonesiaIran, Islamic Rep.IraqIrelandIsraelItalyJamaicaJapanJordanKazakhstanKenyaKiribatiKorea, Rep.KosovoKuwaitKyrgyz RepublicLao PDRLate-demographic dividendLatin America & Caribbean Latin America & Caribbean (excluding high income)Latin America & the Caribbean (IDA & IBRD countries)LatviaLeast developed countries: UN classificationLebanonLesothoLiberiaLibyaLithuaniaLow & middle incomeLow incomeLower middle incomeLuxembourgMacao SAR, ChinaMacedonia, FYRMadagascarMalawiMalaysiaMaldivesMaliMaltaMauritaniaMauritiusMexicoMicronesia, Fed. Sts.Middle East & North AfricaMiddle East & North Africa (excluding high income)Middle East & North Africa (IDA & IBRD countries)Middle incomeMoldovaMongoliaMontenegroMoroccoMozambiqueNamibiaNepalNetherlandsNew CaledoniaNew ZealandNicaraguaNigerNigeriaNorth AmericaNorwayOECD membersOmanPacific island small statesPakistanPanamaPapua New GuineaParaguayPeruPhilippinesPolandPortugalPost-demographic dividendPre-demographic dividendPuerto RicoRomaniaRussian FederationRwandaSaudi ArabiaSenegalSerbiaSeychellesSierra LeoneSingaporeSlovak RepublicSloveniaSolomon IslandsSomaliaSouth AfricaSouth AsiaSouth Asia (IDA & IBRD)South SudanSpainSri LankaSt. Kitts and NevisSt. LuciaSt. Vincent and the GrenadinesSub-Saharan Africa Sub-Saharan Africa (excluding high income)Sub-Saharan Africa (IDA & IBRD countries)SudanSurinameSwazilandSwedenSwitzerlandSyrian Arab RepublicTajikistanTanzaniaThailandTimor-LesteTogoTongaTrinidad and TobagoTunisiaTurkeyTurkmenistanUgandaUkraineUnited Arab EmiratesUnited KingdomUnited StatesUpper middle incomeUruguayUzbekistanVanuatuVenezuela, RBVietnamWest Bank and GazaWorldYemen, Rep.ZambiaZimbabwe Timeline:
This timeline shows a graph from 1961 to 2016 of High income. No data until 1960. Number of actual observations by date: 56.
Source name:
World Development Indicators
Source organization:
World Bank national accounts data, and OECD National Accounts data files.
Categories, topics:
Economy & Growth
Last updated:
apr 23, 2017
Indicators value changes by year
Minimum:
20.054
jan 1, 2011
Maximum:
25.823
jan 1, 1974
At the date of observation
Value
Absolute change
Change from previous value
jan 1, 1961
23.243
+23.243
0.0%
jan 1, 1962
23.96
+0.717
3.08%
jan 1, 1963
24.231
+0.272
1.13%
jan 1, 1964
24.271
+0.04
0.17%
jan 1, 1965
24.42
+0.149
0.61%
jan 1, 1966
23.977
-0.444
-1.82%
jan 1, 1967
24.191
+0.214
0.89%
jan 1, 1968
24.243
+0.053
0.22%
jan 1, 1969
24.359
+0.116
0.48%
jan 1, 1970
24.998
+0.639
2.62%
jan 1, 1971
25.253
+0.256
1.02%
jan 1, 1972
25.145
-0.108
-0.43%
jan 1, 1973
25.27
+0.124
0.5%
jan 1, 1974
25.823
+0.553
2.19%
jan 1, 1975
25.499
-0.324
-1.26%
jan 1, 1976
24.541
-0.957
-3.75%
jan 1, 1977
24.285
-0.257
-1.05%
jan 1, 1978
24.577
+0.292
1.2%
jan 1, 1979
25.075
+0.498
2.03%
jan 1, 1980
25.514
+0.439
1.75%
jan 1, 1981
25.323
-0.191
-0.75%
jan 1, 1982
24.808
-0.515
-2.03%
jan 1, 1983
24.023
-0.785
-3.16%
jan 1, 1984
23.467
-0.557
-2.32%
jan 1, 1985
23.492
+0.026
0.11%
jan 1, 1986
23.508
+0.016
0.07%
jan 1, 1987
23.47
-0.038
-0.16%
jan 1, 1988
23.62
+0.15
0.64%
jan 1, 1989
23.969
+0.35
1.48%
jan 1, 1990
24.311
+0.342
1.43%
jan 1, 1991
24.148
-0.163
-0.67%
jan 1, 1992
23.394
-0.754
-3.12%
jan 1, 1993
22.662
-0.732
-3.13%
jan 1, 1994
22.07
-0.592
-2.61%
jan 1, 1995
22.05
-0.02
-0.09%
jan 1, 1996
22.232
+0.182
0.82%
jan 1, 1997
22.457
+0.225
1.01%
jan 1, 1998
22.493
+0.037
0.16%
jan 1, 1999
22.679
+0.185
0.82%
jan 1, 2000
22.841
+0.163
0.72%
jan 1, 2001
23.068
+0.227
0.99%
jan 1, 2002
22.466
-0.602
-2.61%
jan 1, 2003
21.701
-0.765
-3.41%
jan 1, 2004
21.646
-0.055
-0.25%
jan 1, 2005
21.885
+0.239
1.1%
jan 1, 2006
22.316
+0.431
1.97%
jan 1, 2007
22.704
+0.388
1.74%
jan 1, 2008
22.756
+0.052
0.23%
jan 1, 2009
22.317
-0.439
-1.93%
jan 1, 2010
20.539
-1.778
-7.97%
jan 1, 2011
20.054
-0.485
-2.36%
jan 1, 2012
20.216
+0.162
0.81%
jan 1, 2013
20.422
+0.206
1.02%
jan 1, 2014
20.378
-0.043
-0.21%
jan 1, 2015
20.611
+0.233
1.14%
jan 1, 2016
20.72
+0.109
0.53%
Ranking of countries by current statistics by years


Comments: