29
/
en
AIzaSyAYiBZKx7MnpbEhh9jyipgxe19OcubqV5w
April 1, 2024
259644
Tajikistan
TJK
true
2
1
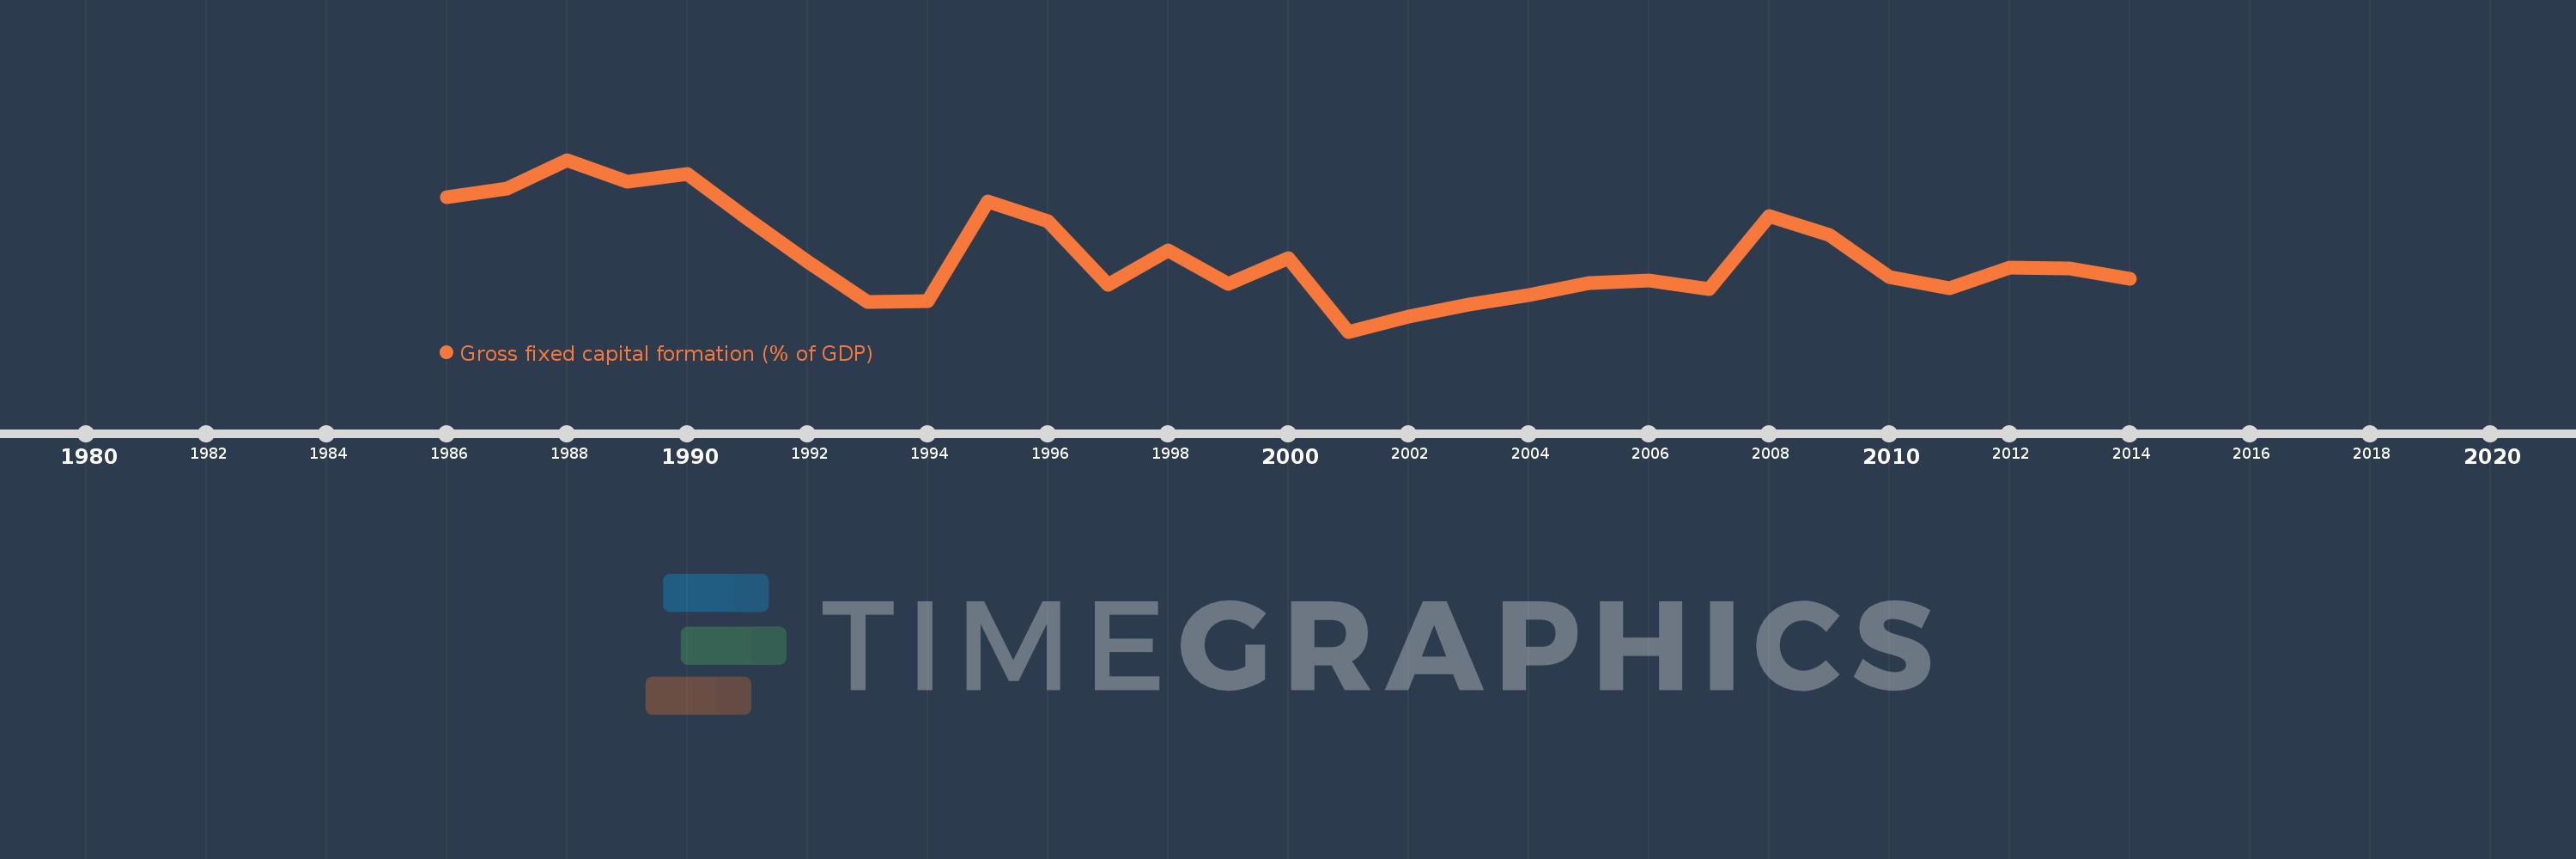
Gross fixed capital formation (% of GDP)
2014,2013,2012,2011,2010,2009,2008,2007,2006,2005,2004,2003,2002,2001,2000,1999,1998,1997,1996,1995,1994,1993,1992,1991,1990,1989,1988,1987,1986
This statistics in other country:
AfghanistanAlbaniaAlgeriaAngolaAntigua and BarbudaArab WorldArgentinaArmeniaArubaAustraliaAustriaAzerbaijanBahamas, TheBahrainBangladeshBarbadosBelarusBelgiumBelizeBeninBermudaBhutanBoliviaBosnia and HerzegovinaBotswanaBrazilBrunei DarussalamBulgariaBurkina FasoBurundiCabo VerdeCambodiaCameroonCanadaCaribbean small statesCentral African RepublicCentral Europe and the BalticsChadChileChinaColombiaComorosCongo, Dem. Rep.Congo, Rep.Costa RicaCote d'IvoireCroatiaCubaCyprusCzech RepublicDenmarkDjiboutiDominicaDominican RepublicEarly-demographic dividendEast Asia & PacificEast Asia & Pacific (excluding high income)East Asia & Pacific (IDA & IBRD countries)EcuadorEgypt, Arab Rep.El SalvadorEquatorial GuineaEritreaEstoniaEthiopiaEuro areaEurope & Central AsiaEurope & Central Asia (excluding high income)Europe & Central Asia (IDA & IBRD countries)European UnionFijiFinlandFragile and conflict affected situationsFranceGabonGambia, TheGeorgiaGermanyGhanaGreeceGrenadaGuatemalaGuineaGuinea-BissauGuyanaHaitiHeavily indebted poor countries (HIPC)High incomeHondurasHong Kong SAR, ChinaHungaryIBRD onlyIcelandIDA & IBRD totalIDA blendIDA onlyIDA totalIndiaIndonesiaIran, Islamic Rep.IraqIrelandIsraelItalyJamaicaJapanJordanKazakhstanKenyaKiribatiKorea, Rep.KosovoKuwaitKyrgyz RepublicLao PDRLate-demographic dividendLatin America & Caribbean Latin America & Caribbean (excluding high income)Latin America & the Caribbean (IDA & IBRD countries)LatviaLeast developed countries: UN classificationLebanonLesothoLiberiaLibyaLithuaniaLow & middle incomeLow incomeLower middle incomeLuxembourgMacao SAR, ChinaMacedonia, FYRMadagascarMalawiMalaysiaMaldivesMaliMaltaMauritaniaMauritiusMexicoMicronesia, Fed. Sts.Middle East & North AfricaMiddle East & North Africa (excluding high income)Middle East & North Africa (IDA & IBRD countries)Middle incomeMoldovaMongoliaMontenegroMoroccoMozambiqueNamibiaNepalNetherlandsNew CaledoniaNew ZealandNicaraguaNigerNigeriaNorth AmericaNorwayOECD membersOmanPacific island small statesPakistanPanamaPapua New GuineaParaguayPeruPhilippinesPolandPortugalPost-demographic dividendPre-demographic dividendPuerto RicoRomaniaRussian FederationRwandaSaudi ArabiaSenegalSerbiaSeychellesSierra LeoneSingaporeSlovak RepublicSloveniaSolomon IslandsSomaliaSouth AfricaSouth AsiaSouth Asia (IDA & IBRD)South SudanSpainSri LankaSt. Kitts and NevisSt. LuciaSt. Vincent and the GrenadinesSub-Saharan Africa Sub-Saharan Africa (excluding high income)Sub-Saharan Africa (IDA & IBRD countries)SudanSurinameSwazilandSwedenSwitzerlandSyrian Arab RepublicTajikistanTanzaniaThailandTimor-LesteTogoTongaTrinidad and TobagoTunisiaTurkeyTurkmenistanUgandaUkraineUnited Arab EmiratesUnited KingdomUnited StatesUpper middle incomeUruguayUzbekistanVanuatuVenezuela, RBVietnamWest Bank and GazaWorldYemen, Rep.ZambiaZimbabwe Timeline:
This timeline shows a graph from 1986 to 2014 of Tajikistan. No data until 1985. Number of actual observations by date: 29.
Source name:
World Development Indicators
Source organization:
World Bank national accounts data, and OECD National Accounts data files.
Categories, topics:
Economy & Growth
Last updated:
apr 23, 2017
Indicators value changes by year
Maximum:
29.032
jan 1, 1988
At the date of observation
Value
Absolute change
Change from previous value
jan 1, 1986
24.288
+24.288
0.0%
jan 1, 1987
25.464
+1.176
4.84%
jan 1, 1988
29.032
+3.569
14.01%
jan 1, 1989
26.308
-2.724
-9.38%
jan 1, 1990
27.246
+0.938
3.57%
jan 1, 1991
21.674
-5.573
-20.45%
jan 1, 1992
16.272
-5.401
-24.92%
jan 1, 1993
11.19
-5.082
-31.23%
jan 1, 1994
11.211
+0.021
0.19%
jan 1, 1995
23.796
+12.585
112.26%
jan 1, 1996
21.3
-2.496
-10.49%
jan 1, 1997
13.295
-8.006
-37.58%
jan 1, 1998
17.674
+4.379
32.94%
jan 1, 1999
13.425
-4.249
-24.04%
jan 1, 2000
16.627
+3.201
23.84%
jan 1, 2001
7.421
-9.205
-55.37%
jan 1, 2002
9.3
+1.879
25.32%
jan 1, 2003
10.8
+1.5
16.13%
jan 1, 2004
12.0
+1.2
11.11%
jan 1, 2005
13.5
+1.5
12.5%
jan 1, 2006
13.8
+0.3
2.22%
jan 1, 2007
12.8
-1.0
-7.25%
jan 1, 2008
22.0
+9.2
71.87%
jan 1, 2009
19.6
-2.4
-10.91%
jan 1, 2010
14.3
-5.3
-27.04%
jan 1, 2011
12.9
-1.4
-9.79%
jan 1, 2012
15.5
+2.6
20.16%
jan 1, 2013
15.4
-0.1
-0.65%
jan 1, 2014
14.1
-1.3
-8.44%
Ranking of countries by current statistics by years


Comments: