29
/
en
AIzaSyAYiBZKx7MnpbEhh9jyipgxe19OcubqV5w
April 1, 2024
101144
Canada
CAN
true
2
1
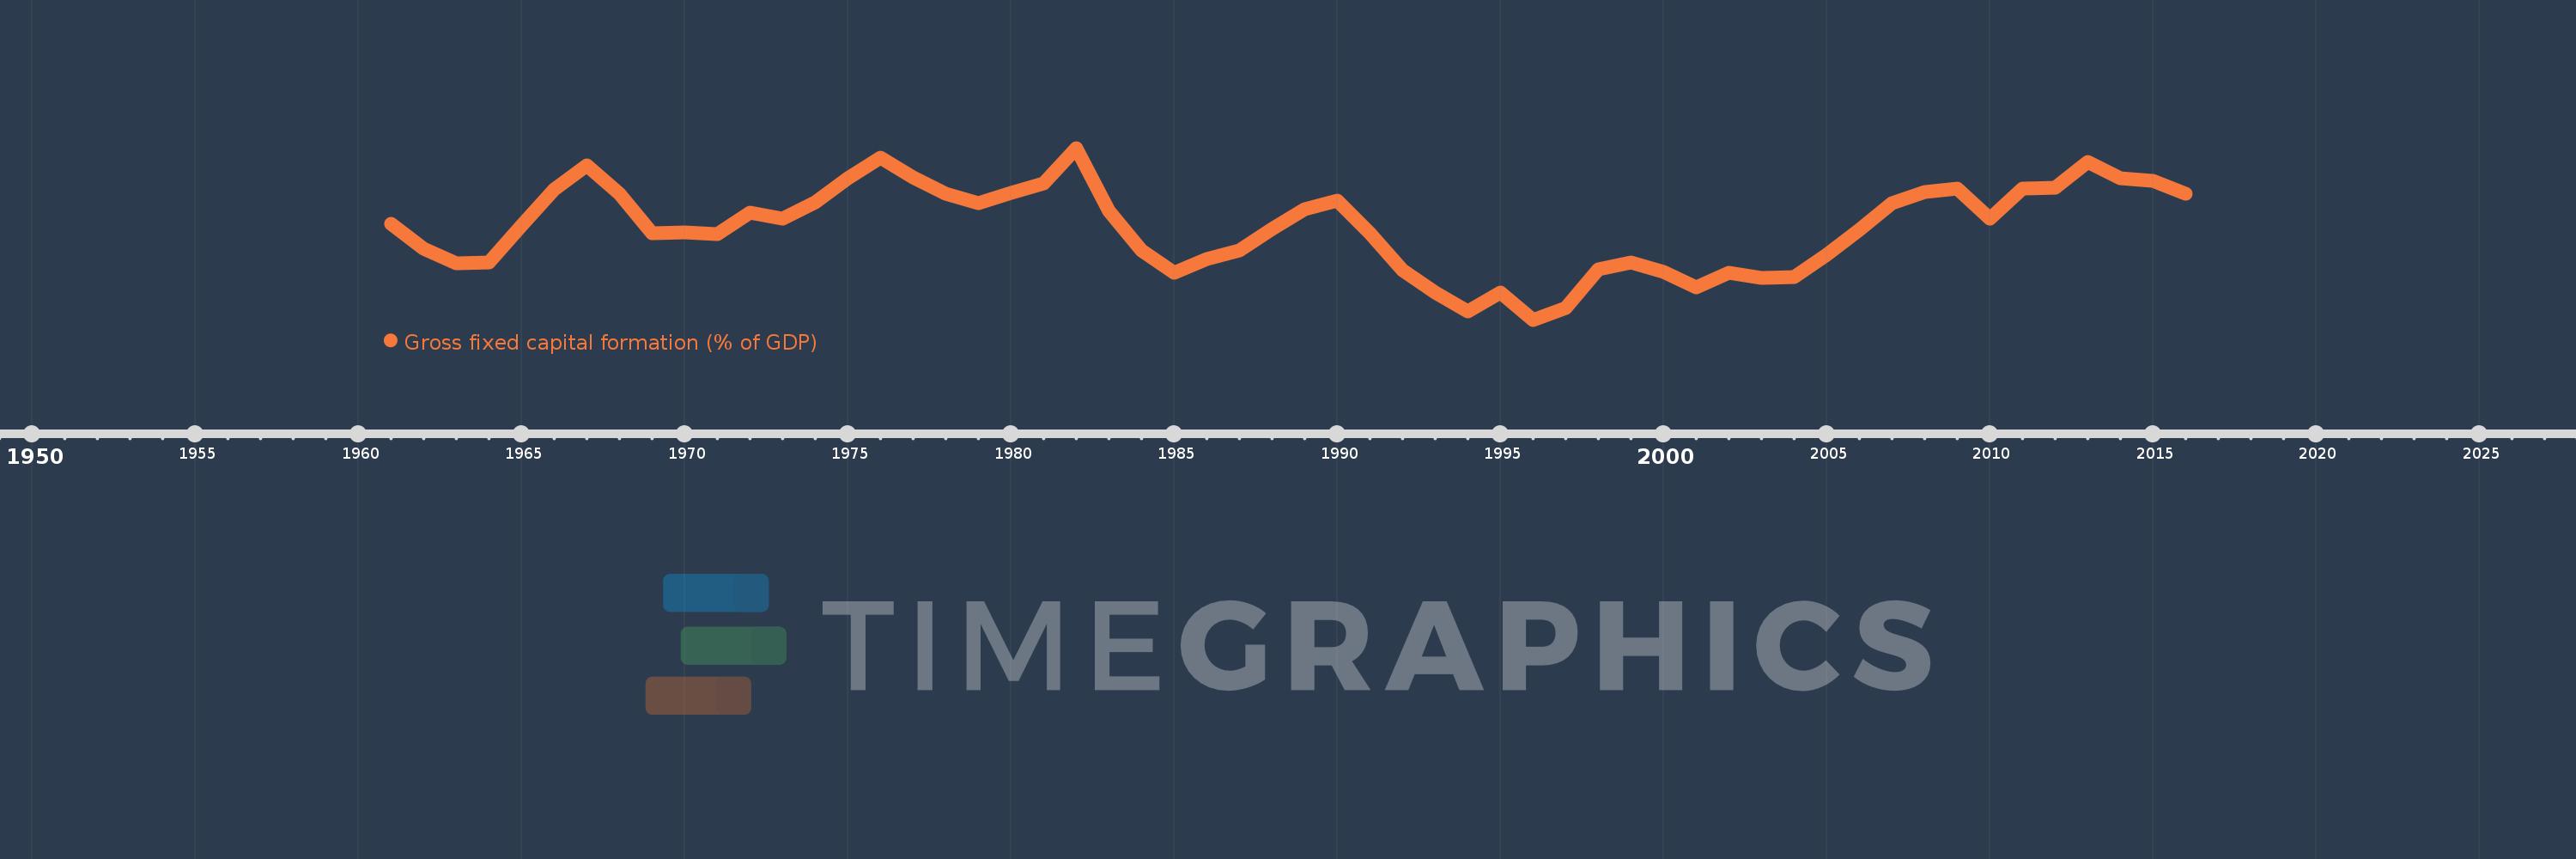
Gross fixed capital formation (% of GDP)
2016,2015,2014,2013,2012,2011,2010,2009,2008,2007,2006,2005,2004,2003,2002,2001,2000,1999,1998,1997,1996,1995,1994,1993,1992,1991,1990,1989,1988,1987,1986,1985,1984,1983,1982,1981,1980,1979,1978,1977,1976,1975,1974,1973,1972,1971,1970,1969,1968,1967,1966,1965,1964,1963,1962,1961
This statistics in other country:
AfghanistanAlbaniaAlgeriaAngolaAntigua and BarbudaArab WorldArgentinaArmeniaArubaAustraliaAustriaAzerbaijanBahamas, TheBahrainBangladeshBarbadosBelarusBelgiumBelizeBeninBermudaBhutanBoliviaBosnia and HerzegovinaBotswanaBrazilBrunei DarussalamBulgariaBurkina FasoBurundiCabo VerdeCambodiaCameroonCanadaCaribbean small statesCentral African RepublicCentral Europe and the BalticsChadChileChinaColombiaComorosCongo, Dem. Rep.Congo, Rep.Costa RicaCote d'IvoireCroatiaCubaCyprusCzech RepublicDenmarkDjiboutiDominicaDominican RepublicEarly-demographic dividendEast Asia & PacificEast Asia & Pacific (excluding high income)East Asia & Pacific (IDA & IBRD countries)EcuadorEgypt, Arab Rep.El SalvadorEquatorial GuineaEritreaEstoniaEthiopiaEuro areaEurope & Central AsiaEurope & Central Asia (excluding high income)Europe & Central Asia (IDA & IBRD countries)European UnionFijiFinlandFragile and conflict affected situationsFranceGabonGambia, TheGeorgiaGermanyGhanaGreeceGrenadaGuatemalaGuineaGuinea-BissauGuyanaHaitiHeavily indebted poor countries (HIPC)High incomeHondurasHong Kong SAR, ChinaHungaryIBRD onlyIcelandIDA & IBRD totalIDA blendIDA onlyIDA totalIndiaIndonesiaIran, Islamic Rep.IraqIrelandIsraelItalyJamaicaJapanJordanKazakhstanKenyaKiribatiKorea, Rep.KosovoKuwaitKyrgyz RepublicLao PDRLate-demographic dividendLatin America & Caribbean Latin America & Caribbean (excluding high income)Latin America & the Caribbean (IDA & IBRD countries)LatviaLeast developed countries: UN classificationLebanonLesothoLiberiaLibyaLithuaniaLow & middle incomeLow incomeLower middle incomeLuxembourgMacao SAR, ChinaMacedonia, FYRMadagascarMalawiMalaysiaMaldivesMaliMaltaMauritaniaMauritiusMexicoMicronesia, Fed. Sts.Middle East & North AfricaMiddle East & North Africa (excluding high income)Middle East & North Africa (IDA & IBRD countries)Middle incomeMoldovaMongoliaMontenegroMoroccoMozambiqueNamibiaNepalNetherlandsNew CaledoniaNew ZealandNicaraguaNigerNigeriaNorth AmericaNorwayOECD membersOmanPacific island small statesPakistanPanamaPapua New GuineaParaguayPeruPhilippinesPolandPortugalPost-demographic dividendPre-demographic dividendPuerto RicoRomaniaRussian FederationRwandaSaudi ArabiaSenegalSerbiaSeychellesSierra LeoneSingaporeSlovak RepublicSloveniaSolomon IslandsSomaliaSouth AfricaSouth AsiaSouth Asia (IDA & IBRD)South SudanSpainSri LankaSt. Kitts and NevisSt. LuciaSt. Vincent and the GrenadinesSub-Saharan Africa Sub-Saharan Africa (excluding high income)Sub-Saharan Africa (IDA & IBRD countries)SudanSurinameSwazilandSwedenSwitzerlandSyrian Arab RepublicTajikistanTanzaniaThailandTimor-LesteTogoTongaTrinidad and TobagoTunisiaTurkeyTurkmenistanUgandaUkraineUnited Arab EmiratesUnited KingdomUnited StatesUpper middle incomeUruguayUzbekistanVanuatuVenezuela, RBVietnamWest Bank and GazaWorldYemen, Rep.ZambiaZimbabwe Timeline:
This timeline shows a graph from 1961 to 2016 of Canada. No data until 1960. Number of actual observations by date: 56.
Source name:
World Development Indicators
Source organization:
World Bank national accounts data, and OECD National Accounts data files.
Categories, topics:
Economy & Growth
Last updated:
apr 23, 2017
Indicators value changes by year
Minimum:
18.406
jan 1, 1996
Maximum:
25.104
jan 1, 1982
At the date of observation
Value
Absolute change
Change from previous value
jan 1, 1961
22.155
+22.155
0.0%
jan 1, 1962
21.172
-0.983
-4.44%
jan 1, 1963
20.598
-0.574
-2.71%
jan 1, 1964
20.624
+0.026
0.13%
jan 1, 1965
22.092
+1.468
7.12%
jan 1, 1966
23.475
+1.382
6.26%
jan 1, 1967
24.421
+0.947
4.03%
jan 1, 1968
23.329
-1.093
-4.47%
jan 1, 1969
21.789
-1.54
-6.6%
jan 1, 1970
21.798
+0.009
0.04%
jan 1, 1971
21.74
-0.058
-0.26%
jan 1, 1972
22.584
+0.844
3.88%
jan 1, 1973
22.359
-0.226
-1.0%
jan 1, 1974
22.985
+0.626
2.8%
jan 1, 1975
23.916
+0.931
4.05%
jan 1, 1976
24.742
+0.826
3.45%
jan 1, 1977
23.954
-0.787
-3.18%
jan 1, 1978
23.328
-0.627
-2.62%
jan 1, 1979
22.964
-0.364
-1.56%
jan 1, 1980
23.353
+0.389
1.69%
jan 1, 1981
23.731
+0.378
1.62%
jan 1, 1982
25.104
+1.373
5.79%
jan 1, 1983
22.651
-2.453
-9.77%
jan 1, 1984
21.105
-1.546
-6.83%
jan 1, 1985
20.236
-0.869
-4.12%
jan 1, 1986
20.788
+0.552
2.73%
jan 1, 1987
21.124
+0.336
1.62%
jan 1, 1988
21.952
+0.828
3.92%
jan 1, 1989
22.719
+0.767
3.49%
jan 1, 1990
23.049
+0.33
1.45%
jan 1, 1991
21.783
-1.266
-5.49%
jan 1, 1992
20.337
-1.446
-6.64%
jan 1, 1993
19.451
-0.886
-4.36%
jan 1, 1994
18.717
-0.733
-3.77%
jan 1, 1995
19.455
+0.737
3.94%
jan 1, 1996
18.406
-1.049
-5.39%
jan 1, 1997
18.868
+0.463
2.51%
jan 1, 1998
20.367
+1.499
7.94%
jan 1, 1999
20.626
+0.259
1.27%
jan 1, 2000
20.26
-0.366
-1.78%
jan 1, 2001
19.665
-0.595
-2.94%
jan 1, 2002
20.223
+0.558
2.84%
jan 1, 2003
20.046
-0.177
-0.87%
jan 1, 2004
20.083
+0.037
0.19%
jan 1, 2005
20.946
+0.863
4.3%
jan 1, 2006
21.907
+0.962
4.59%
jan 1, 2007
22.952
+1.045
4.77%
jan 1, 2008
23.4
+0.448
1.95%
jan 1, 2009
23.527
+0.127
0.54%
jan 1, 2010
22.363
-1.164
-4.95%
jan 1, 2011
23.516
+1.153
5.16%
jan 1, 2012
23.566
+0.049
0.21%
jan 1, 2013
24.553
+0.988
4.19%
jan 1, 2014
23.932
-0.621
-2.53%
jan 1, 2015
23.808
-0.124
-0.52%
jan 1, 2016
23.323
-0.485
-2.04%
Ranking of countries by current statistics by years


Comments: