29
/
en
AIzaSyAYiBZKx7MnpbEhh9jyipgxe19OcubqV5w
April 1, 2024
206809
Nepal
NPL
true
2
1
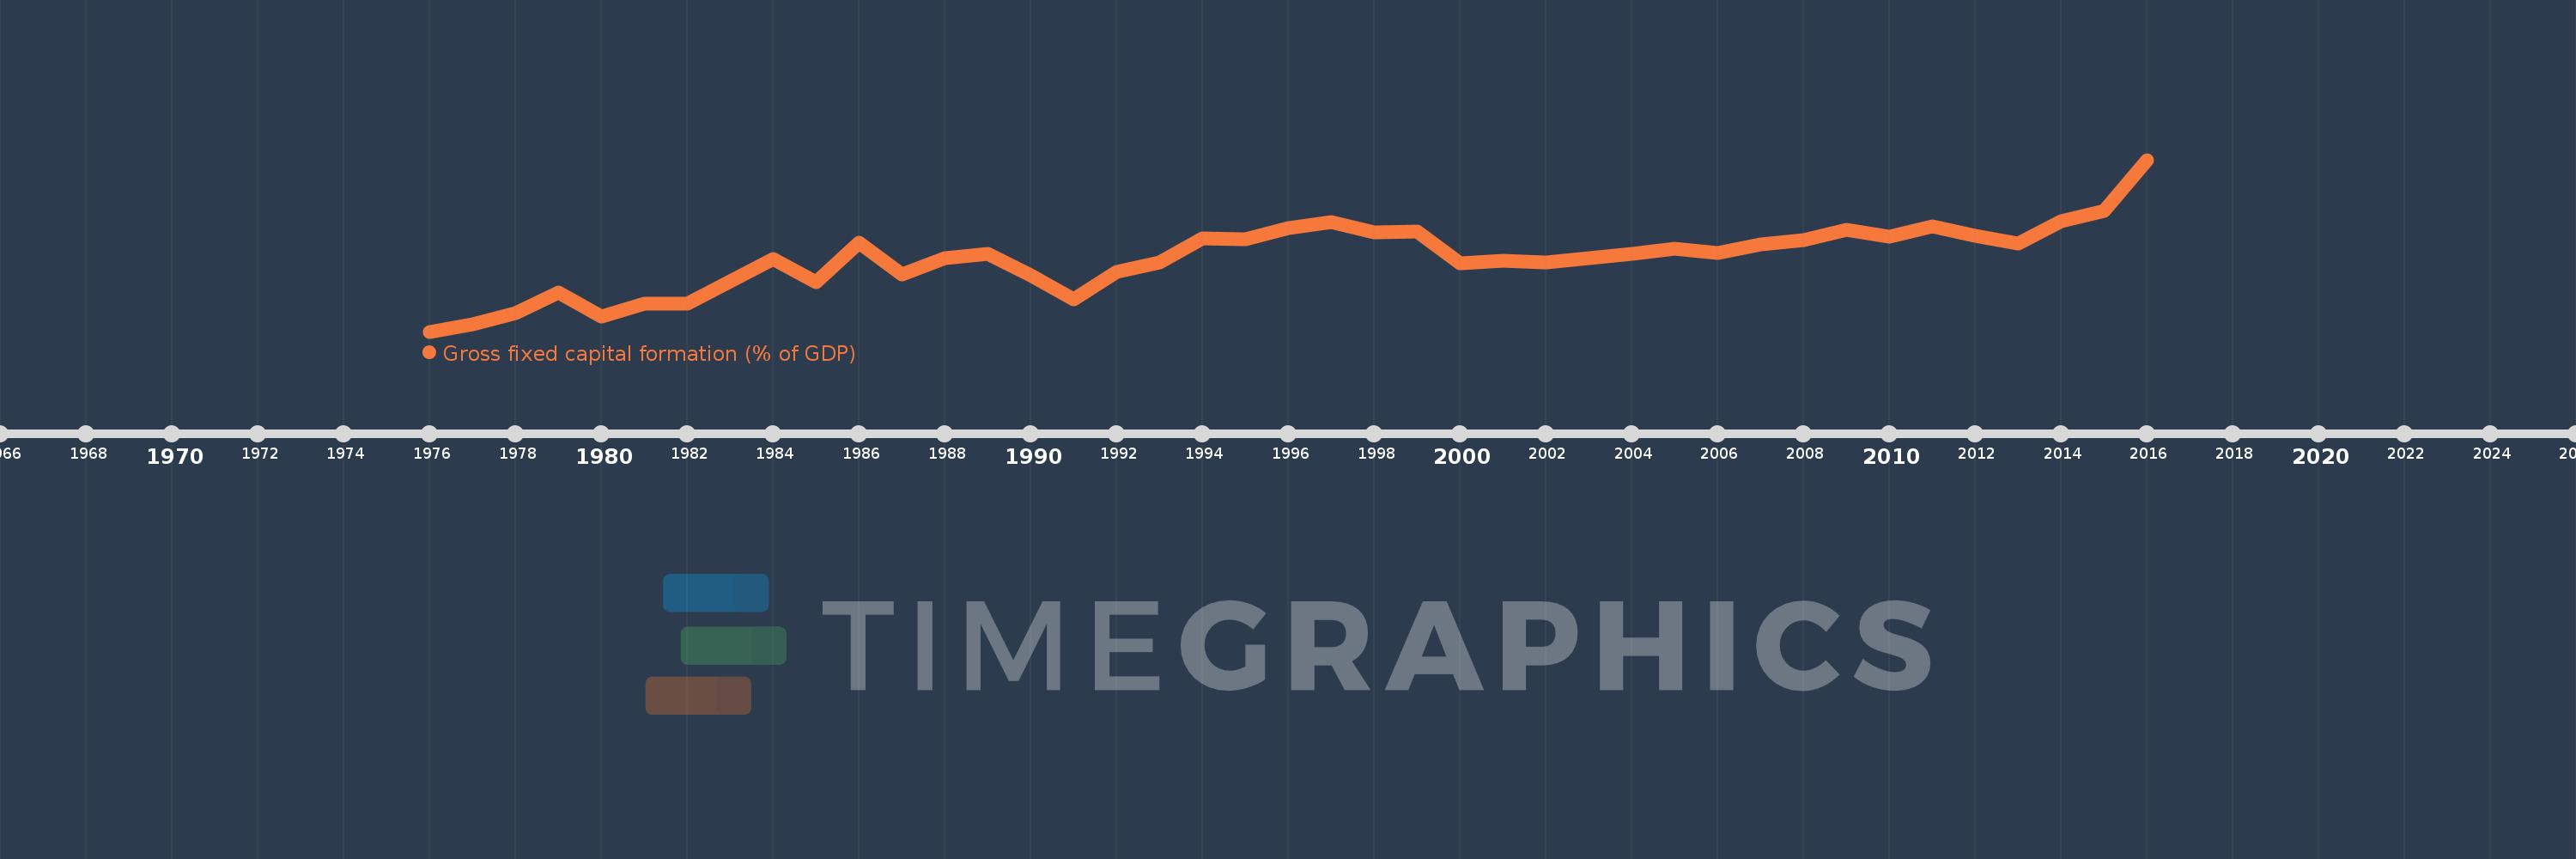
Gross fixed capital formation (% of GDP)
2016,2015,2014,2013,2012,2011,2010,2009,2008,2007,2006,2005,2004,2003,2002,2001,2000,1999,1998,1997,1996,1995,1994,1993,1992,1991,1990,1989,1988,1987,1986,1985,1984,1983,1982,1981,1980,1979,1978,1977,1976
This statistics in other country:
AfghanistanAlbaniaAlgeriaAngolaAntigua and BarbudaArab WorldArgentinaArmeniaArubaAustraliaAustriaAzerbaijanBahamas, TheBahrainBangladeshBarbadosBelarusBelgiumBelizeBeninBermudaBhutanBoliviaBosnia and HerzegovinaBotswanaBrazilBrunei DarussalamBulgariaBurkina FasoBurundiCabo VerdeCambodiaCameroonCanadaCaribbean small statesCentral African RepublicCentral Europe and the BalticsChadChileChinaColombiaComorosCongo, Dem. Rep.Congo, Rep.Costa RicaCote d'IvoireCroatiaCubaCyprusCzech RepublicDenmarkDjiboutiDominicaDominican RepublicEarly-demographic dividendEast Asia & PacificEast Asia & Pacific (excluding high income)East Asia & Pacific (IDA & IBRD countries)EcuadorEgypt, Arab Rep.El SalvadorEquatorial GuineaEritreaEstoniaEthiopiaEuro areaEurope & Central AsiaEurope & Central Asia (excluding high income)Europe & Central Asia (IDA & IBRD countries)European UnionFijiFinlandFragile and conflict affected situationsFranceGabonGambia, TheGeorgiaGermanyGhanaGreeceGrenadaGuatemalaGuineaGuinea-BissauGuyanaHaitiHeavily indebted poor countries (HIPC)High incomeHondurasHong Kong SAR, ChinaHungaryIBRD onlyIcelandIDA & IBRD totalIDA blendIDA onlyIDA totalIndiaIndonesiaIran, Islamic Rep.IraqIrelandIsraelItalyJamaicaJapanJordanKazakhstanKenyaKiribatiKorea, Rep.KosovoKuwaitKyrgyz RepublicLao PDRLate-demographic dividendLatin America & Caribbean Latin America & Caribbean (excluding high income)Latin America & the Caribbean (IDA & IBRD countries)LatviaLeast developed countries: UN classificationLebanonLesothoLiberiaLibyaLithuaniaLow & middle incomeLow incomeLower middle incomeLuxembourgMacao SAR, ChinaMacedonia, FYRMadagascarMalawiMalaysiaMaldivesMaliMaltaMauritaniaMauritiusMexicoMicronesia, Fed. Sts.Middle East & North AfricaMiddle East & North Africa (excluding high income)Middle East & North Africa (IDA & IBRD countries)Middle incomeMoldovaMongoliaMontenegroMoroccoMozambiqueNamibiaNepalNetherlandsNew CaledoniaNew ZealandNicaraguaNigerNigeriaNorth AmericaNorwayOECD membersOmanPacific island small statesPakistanPanamaPapua New GuineaParaguayPeruPhilippinesPolandPortugalPost-demographic dividendPre-demographic dividendPuerto RicoRomaniaRussian FederationRwandaSaudi ArabiaSenegalSerbiaSeychellesSierra LeoneSingaporeSlovak RepublicSloveniaSolomon IslandsSomaliaSouth AfricaSouth AsiaSouth Asia (IDA & IBRD)South SudanSpainSri LankaSt. Kitts and NevisSt. LuciaSt. Vincent and the GrenadinesSub-Saharan Africa Sub-Saharan Africa (excluding high income)Sub-Saharan Africa (IDA & IBRD countries)SudanSurinameSwazilandSwedenSwitzerlandSyrian Arab RepublicTajikistanTanzaniaThailandTimor-LesteTogoTongaTrinidad and TobagoTunisiaTurkeyTurkmenistanUgandaUkraineUnited Arab EmiratesUnited KingdomUnited StatesUpper middle incomeUruguayUzbekistanVanuatuVenezuela, RBVietnamWest Bank and GazaWorldYemen, Rep.ZambiaZimbabwe Timeline:
This timeline shows a graph from 1976 to 2016 of Nepal. No data until 1975. Number of actual observations by date: 41.
Source name:
World Development Indicators
Source organization:
World Bank national accounts data, and OECD National Accounts data files.
Categories, topics:
Economy & Growth
Last updated:
apr 23, 2017
Indicators value changes by year
Minimum:
13.415
jan 1, 1976
Maximum:
27.746
jan 1, 2016
At the date of observation
Value
Absolute change
Change from previous value
jan 1, 1976
13.415
+13.415
0.0%
jan 1, 1977
14.045
+0.63
4.7%
jan 1, 1978
14.936
+0.891
6.35%
jan 1, 1979
16.694
+1.757
11.77%
jan 1, 1980
14.688
-2.005
-12.01%
jan 1, 1981
15.764
+1.076
7.32%
jan 1, 1982
15.743
-0.021
-0.13%
jan 1, 1983
17.636
+1.893
12.02%
jan 1, 1984
19.479
+1.843
10.45%
jan 1, 1985
17.535
-1.944
-9.98%
jan 1, 1986
20.843
+3.308
18.87%
jan 1, 1987
18.168
-2.675
-12.83%
jan 1, 1988
19.509
+1.341
7.38%
jan 1, 1989
19.922
+0.413
2.12%
jan 1, 1990
18.121
-1.801
-9.04%
jan 1, 1991
16.12
-2.0
-11.04%
jan 1, 1992
18.4
+2.28
14.14%
jan 1, 1993
19.171
+0.771
4.19%
jan 1, 1994
21.219
+2.048
10.68%
jan 1, 1995
21.093
-0.126
-0.59%
jan 1, 1996
22.069
+0.976
4.63%
jan 1, 1997
22.53
+0.461
2.09%
jan 1, 1998
21.672
-0.858
-3.81%
jan 1, 1999
21.73
+0.058
0.27%
jan 1, 2000
19.082
-2.648
-12.19%
jan 1, 2001
19.322
+0.239
1.25%
jan 1, 2002
19.195
-0.127
-0.66%
jan 1, 2003
19.565
+0.37
1.93%
jan 1, 2004
19.924
+0.359
1.84%
jan 1, 2005
20.341
+0.417
2.09%
jan 1, 2006
19.942
-0.399
-1.96%
jan 1, 2007
20.721
+0.779
3.91%
jan 1, 2008
21.068
+0.347
1.67%
jan 1, 2009
21.878
+0.81
3.84%
jan 1, 2010
21.354
-0.523
-2.39%
jan 1, 2011
22.208
+0.853
4.0%
jan 1, 2012
21.415
-0.793
-3.57%
jan 1, 2013
20.767
-0.648
-3.02%
jan 1, 2014
22.594
+1.827
8.8%
jan 1, 2015
23.518
+0.924
4.09%
jan 1, 2016
27.746
+4.228
17.98%
Ranking of countries by current statistics by years


Comments: