29
/
en
AIzaSyAYiBZKx7MnpbEhh9jyipgxe19OcubqV5w
April 1, 2024
26553
Early-demographic dividend
EAR
false
2
1
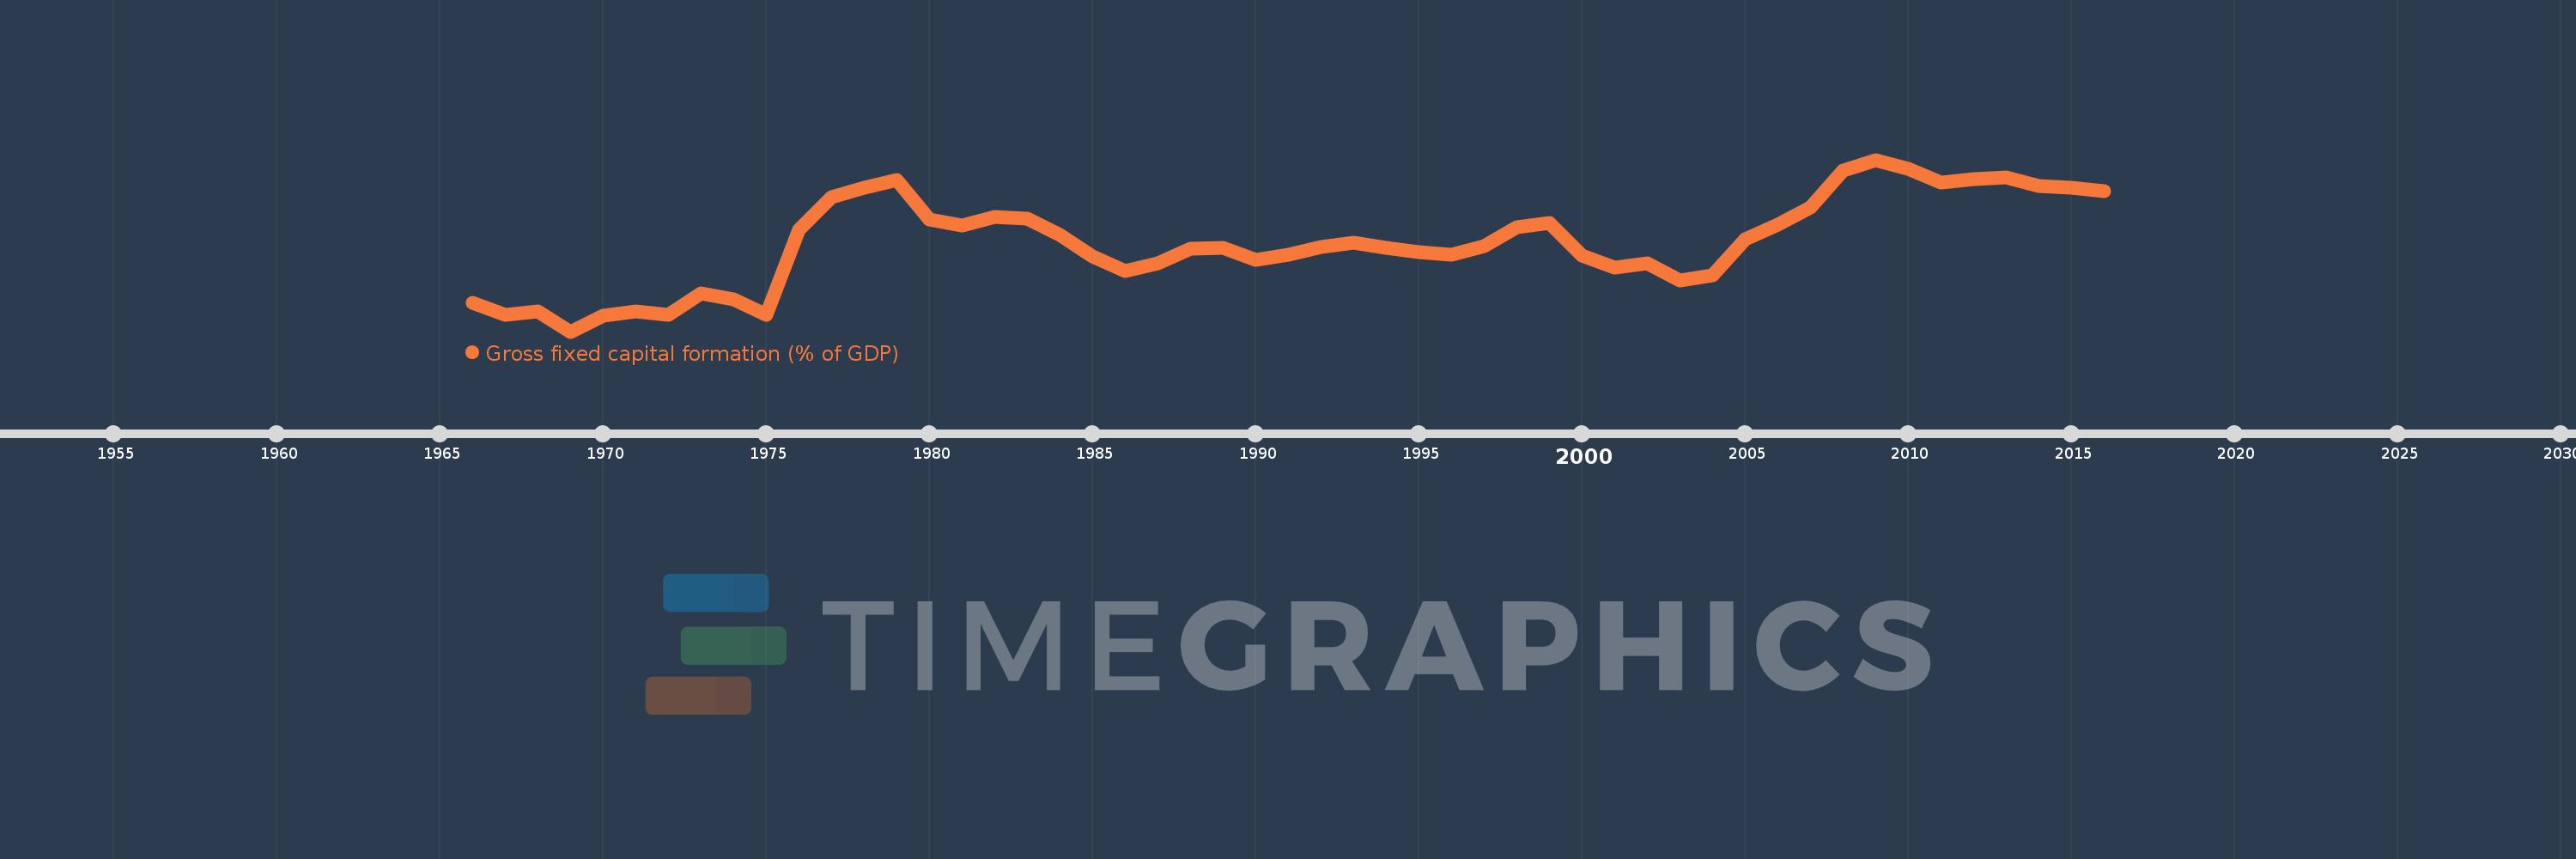
Gross fixed capital formation (% of GDP)
2016,2015,2014,2013,2012,2011,2010,2009,2008,2007,2006,2005,2004,2003,2002,2001,2000,1999,1998,1997,1996,1995,1994,1993,1992,1991,1990,1989,1988,1987,1986,1985,1984,1983,1982,1981,1980,1979,1978,1977,1976,1975,1974,1973,1972,1971,1970,1969,1968,1967,1966
This statistics in other country:
AfghanistanAlbaniaAlgeriaAngolaAntigua and BarbudaArab WorldArgentinaArmeniaArubaAustraliaAustriaAzerbaijanBahamas, TheBahrainBangladeshBarbadosBelarusBelgiumBelizeBeninBermudaBhutanBoliviaBosnia and HerzegovinaBotswanaBrazilBrunei DarussalamBulgariaBurkina FasoBurundiCabo VerdeCambodiaCameroonCanadaCaribbean small statesCentral African RepublicCentral Europe and the BalticsChadChileChinaColombiaComorosCongo, Dem. Rep.Congo, Rep.Costa RicaCote d'IvoireCroatiaCubaCyprusCzech RepublicDenmarkDjiboutiDominicaDominican RepublicEarly-demographic dividendEast Asia & PacificEast Asia & Pacific (excluding high income)East Asia & Pacific (IDA & IBRD countries)EcuadorEgypt, Arab Rep.El SalvadorEquatorial GuineaEritreaEstoniaEthiopiaEuro areaEurope & Central AsiaEurope & Central Asia (excluding high income)Europe & Central Asia (IDA & IBRD countries)European UnionFijiFinlandFragile and conflict affected situationsFranceGabonGambia, TheGeorgiaGermanyGhanaGreeceGrenadaGuatemalaGuineaGuinea-BissauGuyanaHaitiHeavily indebted poor countries (HIPC)High incomeHondurasHong Kong SAR, ChinaHungaryIBRD onlyIcelandIDA & IBRD totalIDA blendIDA onlyIDA totalIndiaIndonesiaIran, Islamic Rep.IraqIrelandIsraelItalyJamaicaJapanJordanKazakhstanKenyaKiribatiKorea, Rep.KosovoKuwaitKyrgyz RepublicLao PDRLate-demographic dividendLatin America & Caribbean Latin America & Caribbean (excluding high income)Latin America & the Caribbean (IDA & IBRD countries)LatviaLeast developed countries: UN classificationLebanonLesothoLiberiaLibyaLithuaniaLow & middle incomeLow incomeLower middle incomeLuxembourgMacao SAR, ChinaMacedonia, FYRMadagascarMalawiMalaysiaMaldivesMaliMaltaMauritaniaMauritiusMexicoMicronesia, Fed. Sts.Middle East & North AfricaMiddle East & North Africa (excluding high income)Middle East & North Africa (IDA & IBRD countries)Middle incomeMoldovaMongoliaMontenegroMoroccoMozambiqueNamibiaNepalNetherlandsNew CaledoniaNew ZealandNicaraguaNigerNigeriaNorth AmericaNorwayOECD membersOmanPacific island small statesPakistanPanamaPapua New GuineaParaguayPeruPhilippinesPolandPortugalPost-demographic dividendPre-demographic dividendPuerto RicoRomaniaRussian FederationRwandaSaudi ArabiaSenegalSerbiaSeychellesSierra LeoneSingaporeSlovak RepublicSloveniaSolomon IslandsSomaliaSouth AfricaSouth AsiaSouth Asia (IDA & IBRD)South SudanSpainSri LankaSt. Kitts and NevisSt. LuciaSt. Vincent and the GrenadinesSub-Saharan Africa Sub-Saharan Africa (excluding high income)Sub-Saharan Africa (IDA & IBRD countries)SudanSurinameSwazilandSwedenSwitzerlandSyrian Arab RepublicTajikistanTanzaniaThailandTimor-LesteTogoTongaTrinidad and TobagoTunisiaTurkeyTurkmenistanUgandaUkraineUnited Arab EmiratesUnited KingdomUnited StatesUpper middle incomeUruguayUzbekistanVanuatuVenezuela, RBVietnamWest Bank and GazaWorldYemen, Rep.ZambiaZimbabwe Timeline:
This timeline shows a graph from 1966 to 2016 of Early-demographic dividend. No data until 1965. Number of actual observations by date: 51.
Source name:
World Development Indicators
Source organization:
World Bank national accounts data, and OECD National Accounts data files.
Categories, topics:
Economy & Growth
Last updated:
apr 23, 2017
Indicators value changes by year
Minimum:
17.866
jan 1, 1969
Maximum:
25.665
jan 1, 2009
At the date of observation
Value
Absolute change
Change from previous value
jan 1, 1966
19.161
+19.161
0.0%
jan 1, 1967
18.613
-0.548
-2.86%
jan 1, 1968
18.788
+0.175
0.94%
jan 1, 1969
17.866
-0.922
-4.91%
jan 1, 1970
18.595
+0.73
4.08%
jan 1, 1971
18.799
+0.203
1.09%
jan 1, 1972
18.635
-0.164
-0.87%
jan 1, 1973
19.598
+0.963
5.17%
jan 1, 1974
19.337
-0.261
-1.33%
jan 1, 1975
18.61
-0.727
-3.76%
jan 1, 1976
22.477
+3.867
20.78%
jan 1, 1977
23.979
+1.501
6.68%
jan 1, 1978
24.409
+0.43
1.79%
jan 1, 1979
24.762
+0.353
1.45%
jan 1, 1980
22.943
-1.818
-7.34%
jan 1, 1981
22.675
-0.269
-1.17%
jan 1, 1982
23.065
+0.39
1.72%
jan 1, 1983
22.986
-0.079
-0.34%
jan 1, 1984
22.25
-0.735
-3.2%
jan 1, 1985
21.268
-0.982
-4.41%
jan 1, 1986
20.602
-0.666
-3.13%
jan 1, 1987
20.972
+0.369
1.79%
jan 1, 1988
21.618
+0.647
3.08%
jan 1, 1989
21.671
+0.053
0.25%
jan 1, 1990
21.113
-0.558
-2.58%
jan 1, 1991
21.339
+0.226
1.07%
jan 1, 1992
21.688
+0.349
1.64%
jan 1, 1993
21.897
+0.208
0.96%
jan 1, 1994
21.654
-0.242
-1.11%
jan 1, 1995
21.477
-0.177
-0.82%
jan 1, 1996
21.362
-0.116
-0.54%
jan 1, 1997
21.755
+0.393
1.84%
jan 1, 1998
22.598
+0.843
3.88%
jan 1, 1999
22.812
+0.214
0.95%
jan 1, 2000
21.325
-1.487
-6.52%
jan 1, 2001
20.782
-0.543
-2.55%
jan 1, 2002
20.961
+0.179
0.86%
jan 1, 2003
20.17
-0.791
-3.77%
jan 1, 2004
20.431
+0.261
1.3%
jan 1, 2005
22.067
+1.636
8.01%
jan 1, 2006
22.725
+0.658
2.98%
jan 1, 2007
23.487
+0.762
3.35%
jan 1, 2008
25.192
+1.705
7.26%
jan 1, 2009
25.665
+0.473
1.88%
jan 1, 2010
25.253
-0.412
-1.6%
jan 1, 2011
24.644
-0.609
-2.41%
jan 1, 2012
24.788
+0.144
0.58%
jan 1, 2013
24.855
+0.068
0.27%
jan 1, 2014
24.472
-0.383
-1.54%
jan 1, 2015
24.408
-0.065
-0.26%
jan 1, 2016
24.248
-0.16
-0.65%
Ranking of countries by current statistics by years


Comments: