29
/
en
AIzaSyAYiBZKx7MnpbEhh9jyipgxe19OcubqV5w
April 1, 2024
66059
Algeria
DZA
true
2
1
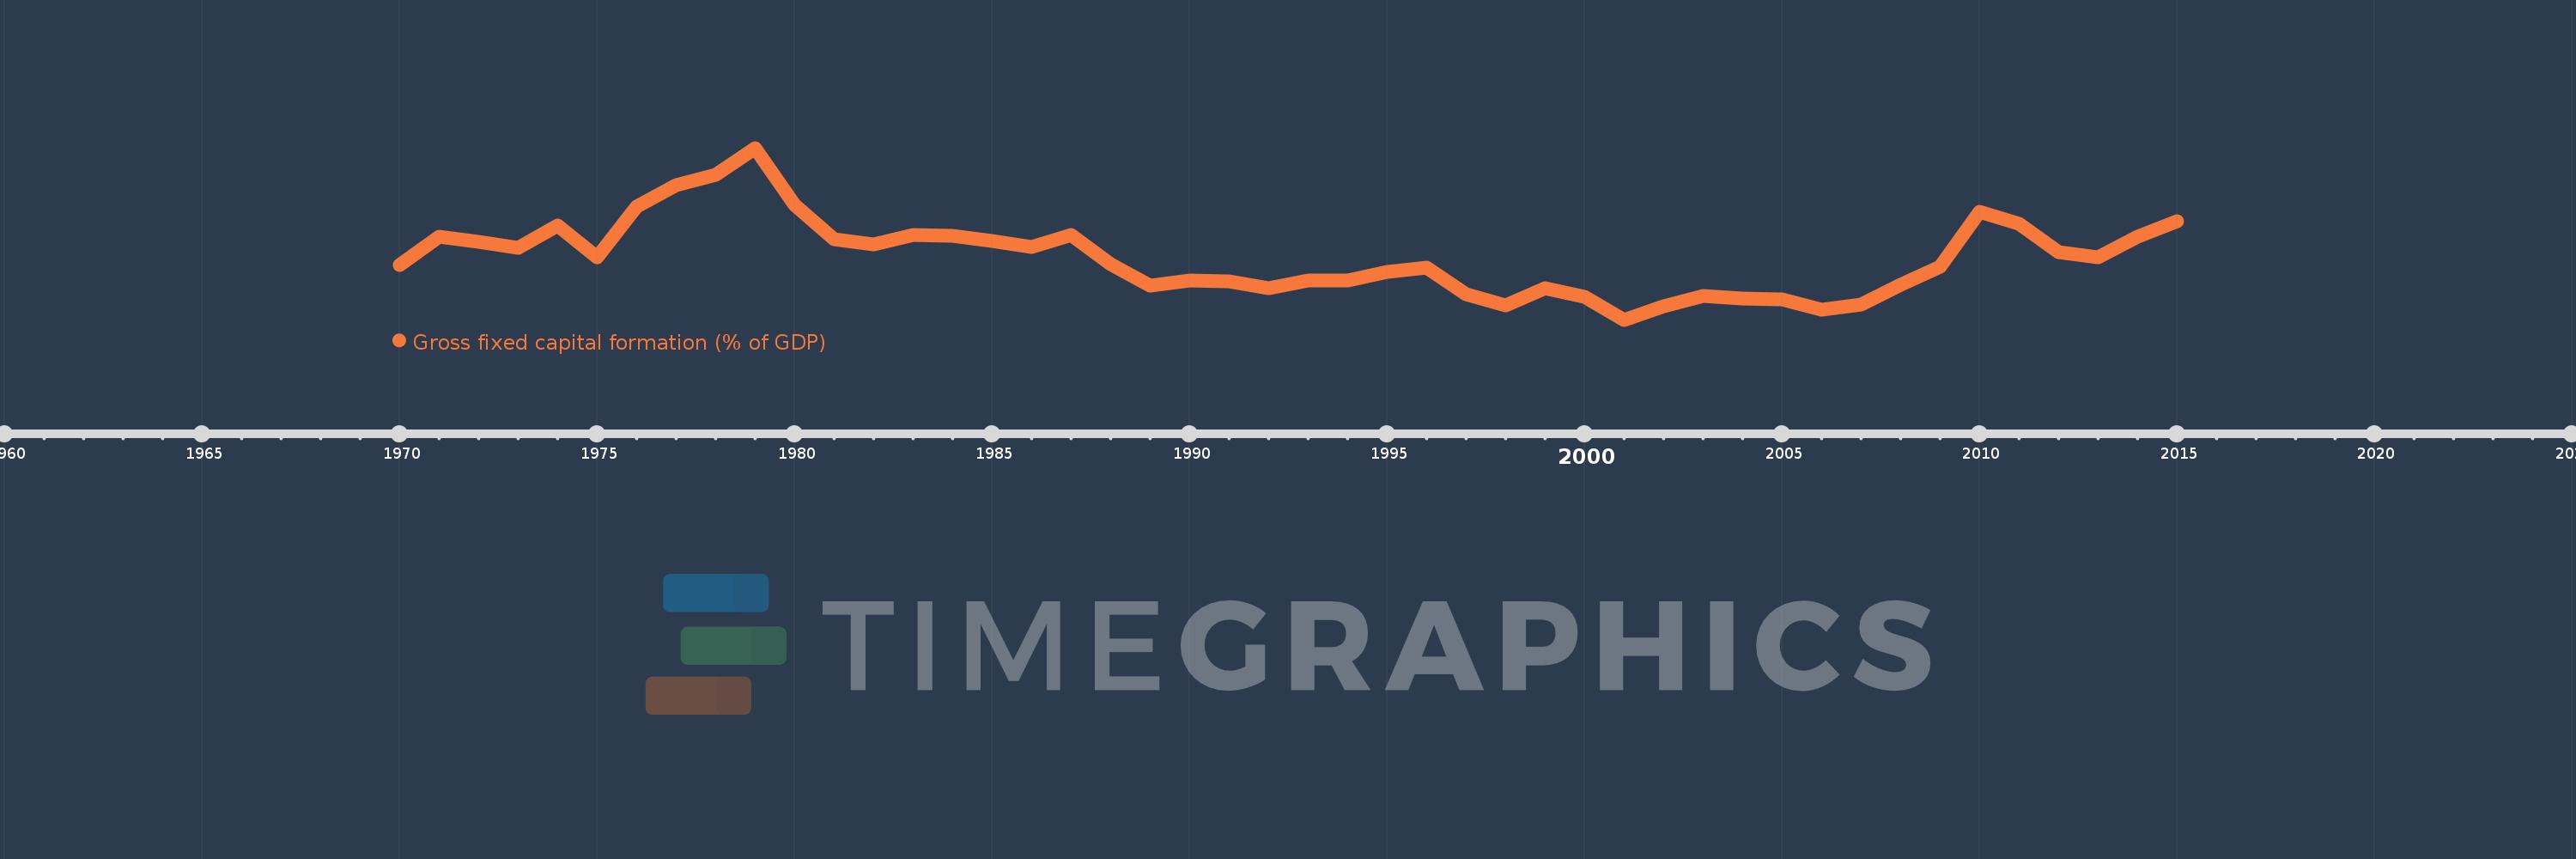
Gross fixed capital formation (% of GDP)
2015,2014,2013,2012,2011,2010,2009,2008,2007,2006,2005,2004,2003,2002,2001,2000,1999,1998,1997,1996,1995,1994,1993,1992,1991,1990,1989,1988,1987,1986,1985,1984,1983,1982,1981,1980,1979,1978,1977,1976,1975,1974,1973,1972,1971,1970
This statistics in other country:
AfghanistanAlbaniaAlgeriaAngolaAntigua and BarbudaArab WorldArgentinaArmeniaArubaAustraliaAustriaAzerbaijanBahamas, TheBahrainBangladeshBarbadosBelarusBelgiumBelizeBeninBermudaBhutanBoliviaBosnia and HerzegovinaBotswanaBrazilBrunei DarussalamBulgariaBurkina FasoBurundiCabo VerdeCambodiaCameroonCanadaCaribbean small statesCentral African RepublicCentral Europe and the BalticsChadChileChinaColombiaComorosCongo, Dem. Rep.Congo, Rep.Costa RicaCote d'IvoireCroatiaCubaCyprusCzech RepublicDenmarkDjiboutiDominicaDominican RepublicEarly-demographic dividendEast Asia & PacificEast Asia & Pacific (excluding high income)East Asia & Pacific (IDA & IBRD countries)EcuadorEgypt, Arab Rep.El SalvadorEquatorial GuineaEritreaEstoniaEthiopiaEuro areaEurope & Central AsiaEurope & Central Asia (excluding high income)Europe & Central Asia (IDA & IBRD countries)European UnionFijiFinlandFragile and conflict affected situationsFranceGabonGambia, TheGeorgiaGermanyGhanaGreeceGrenadaGuatemalaGuineaGuinea-BissauGuyanaHaitiHeavily indebted poor countries (HIPC)High incomeHondurasHong Kong SAR, ChinaHungaryIBRD onlyIcelandIDA & IBRD totalIDA blendIDA onlyIDA totalIndiaIndonesiaIran, Islamic Rep.IraqIrelandIsraelItalyJamaicaJapanJordanKazakhstanKenyaKiribatiKorea, Rep.KosovoKuwaitKyrgyz RepublicLao PDRLate-demographic dividendLatin America & Caribbean Latin America & Caribbean (excluding high income)Latin America & the Caribbean (IDA & IBRD countries)LatviaLeast developed countries: UN classificationLebanonLesothoLiberiaLibyaLithuaniaLow & middle incomeLow incomeLower middle incomeLuxembourgMacao SAR, ChinaMacedonia, FYRMadagascarMalawiMalaysiaMaldivesMaliMaltaMauritaniaMauritiusMexicoMicronesia, Fed. Sts.Middle East & North AfricaMiddle East & North Africa (excluding high income)Middle East & North Africa (IDA & IBRD countries)Middle incomeMoldovaMongoliaMontenegroMoroccoMozambiqueNamibiaNepalNetherlandsNew CaledoniaNew ZealandNicaraguaNigerNigeriaNorth AmericaNorwayOECD membersOmanPacific island small statesPakistanPanamaPapua New GuineaParaguayPeruPhilippinesPolandPortugalPost-demographic dividendPre-demographic dividendPuerto RicoRomaniaRussian FederationRwandaSaudi ArabiaSenegalSerbiaSeychellesSierra LeoneSingaporeSlovak RepublicSloveniaSolomon IslandsSomaliaSouth AfricaSouth AsiaSouth Asia (IDA & IBRD)South SudanSpainSri LankaSt. Kitts and NevisSt. LuciaSt. Vincent and the GrenadinesSub-Saharan Africa Sub-Saharan Africa (excluding high income)Sub-Saharan Africa (IDA & IBRD countries)SudanSurinameSwazilandSwedenSwitzerlandSyrian Arab RepublicTajikistanTanzaniaThailandTimor-LesteTogoTongaTrinidad and TobagoTunisiaTurkeyTurkmenistanUgandaUkraineUnited Arab EmiratesUnited KingdomUnited StatesUpper middle incomeUruguayUzbekistanVanuatuVenezuela, RBVietnamWest Bank and GazaWorldYemen, Rep.ZambiaZimbabwe Timeline:
This timeline shows a graph from 1970 to 2015 of Algeria. No data until 1969. Number of actual observations by date: 46.
Source name:
World Development Indicators
Source organization:
World Bank national accounts data, and OECD National Accounts data files.
Categories, topics:
Economy & Growth
Last updated:
apr 23, 2017
Indicators value changes by year
Minimum:
20.677
jan 1, 2001
Maximum:
48.585
jan 1, 1979
At the date of observation
Value
Absolute change
Change from previous value
jan 1, 1970
29.498
+29.498
0.0%
jan 1, 1971
34.15
+4.652
15.77%
jan 1, 1972
33.277
-0.874
-2.56%
jan 1, 1973
32.323
-0.953
-2.86%
jan 1, 1974
35.937
+3.613
11.18%
jan 1, 1975
30.782
-5.155
-14.34%
jan 1, 1976
39.06
+8.278
26.89%
jan 1, 1977
42.537
+3.478
8.9%
jan 1, 1978
44.155
+1.618
3.8%
jan 1, 1979
48.585
+4.43
10.03%
jan 1, 1980
39.345
-9.24
-19.02%
jan 1, 1981
33.785
-5.561
-14.13%
jan 1, 1982
32.915
-0.869
-2.57%
jan 1, 1983
34.441
+1.526
4.64%
jan 1, 1984
34.36
-0.081
-0.24%
jan 1, 1985
33.483
-0.877
-2.55%
jan 1, 1986
32.441
-1.042
-3.11%
jan 1, 1987
34.457
+2.017
6.22%
jan 1, 1988
29.688
-4.769
-13.84%
jan 1, 1989
26.237
-3.451
-11.62%
jan 1, 1990
27.12
+0.883
3.36%
jan 1, 1991
26.97
-0.15
-0.55%
jan 1, 1992
25.861
-1.109
-4.11%
jan 1, 1993
27.075
+1.214
4.69%
jan 1, 1994
27.007
-0.068
-0.25%
jan 1, 1995
28.401
+1.394
5.16%
jan 1, 1996
29.137
+0.736
2.59%
jan 1, 1997
24.879
-4.258
-14.61%
jan 1, 1998
22.952
-1.928
-7.75%
jan 1, 1999
25.748
+2.797
12.18%
jan 1, 2000
24.39
-1.358
-5.27%
jan 1, 2001
20.677
-3.713
-15.23%
jan 1, 2002
22.84
+2.163
10.46%
jan 1, 2003
24.571
+1.732
7.58%
jan 1, 2004
24.088
-0.484
-1.97%
jan 1, 2005
24.018
-0.07
-0.29%
jan 1, 2006
22.37
-1.648
-6.86%
jan 1, 2007
23.166
+0.795
3.56%
jan 1, 2008
26.325
+3.159
13.64%
jan 1, 2009
29.232
+2.908
11.05%
jan 1, 2010
38.236
+9.004
30.8%
jan 1, 2011
36.283
-1.953
-5.11%
jan 1, 2012
31.671
-4.612
-12.71%
jan 1, 2013
30.801
-0.87
-2.75%
jan 1, 2014
34.192
+3.391
11.01%
jan 1, 2015
36.686
+2.494
7.29%
Ranking of countries by current statistics by years


Comments: