29
/
en
AIzaSyAYiBZKx7MnpbEhh9jyipgxe19OcubqV5w
April 1, 2024
40748
Late-demographic dividend
LTE
false
2
1
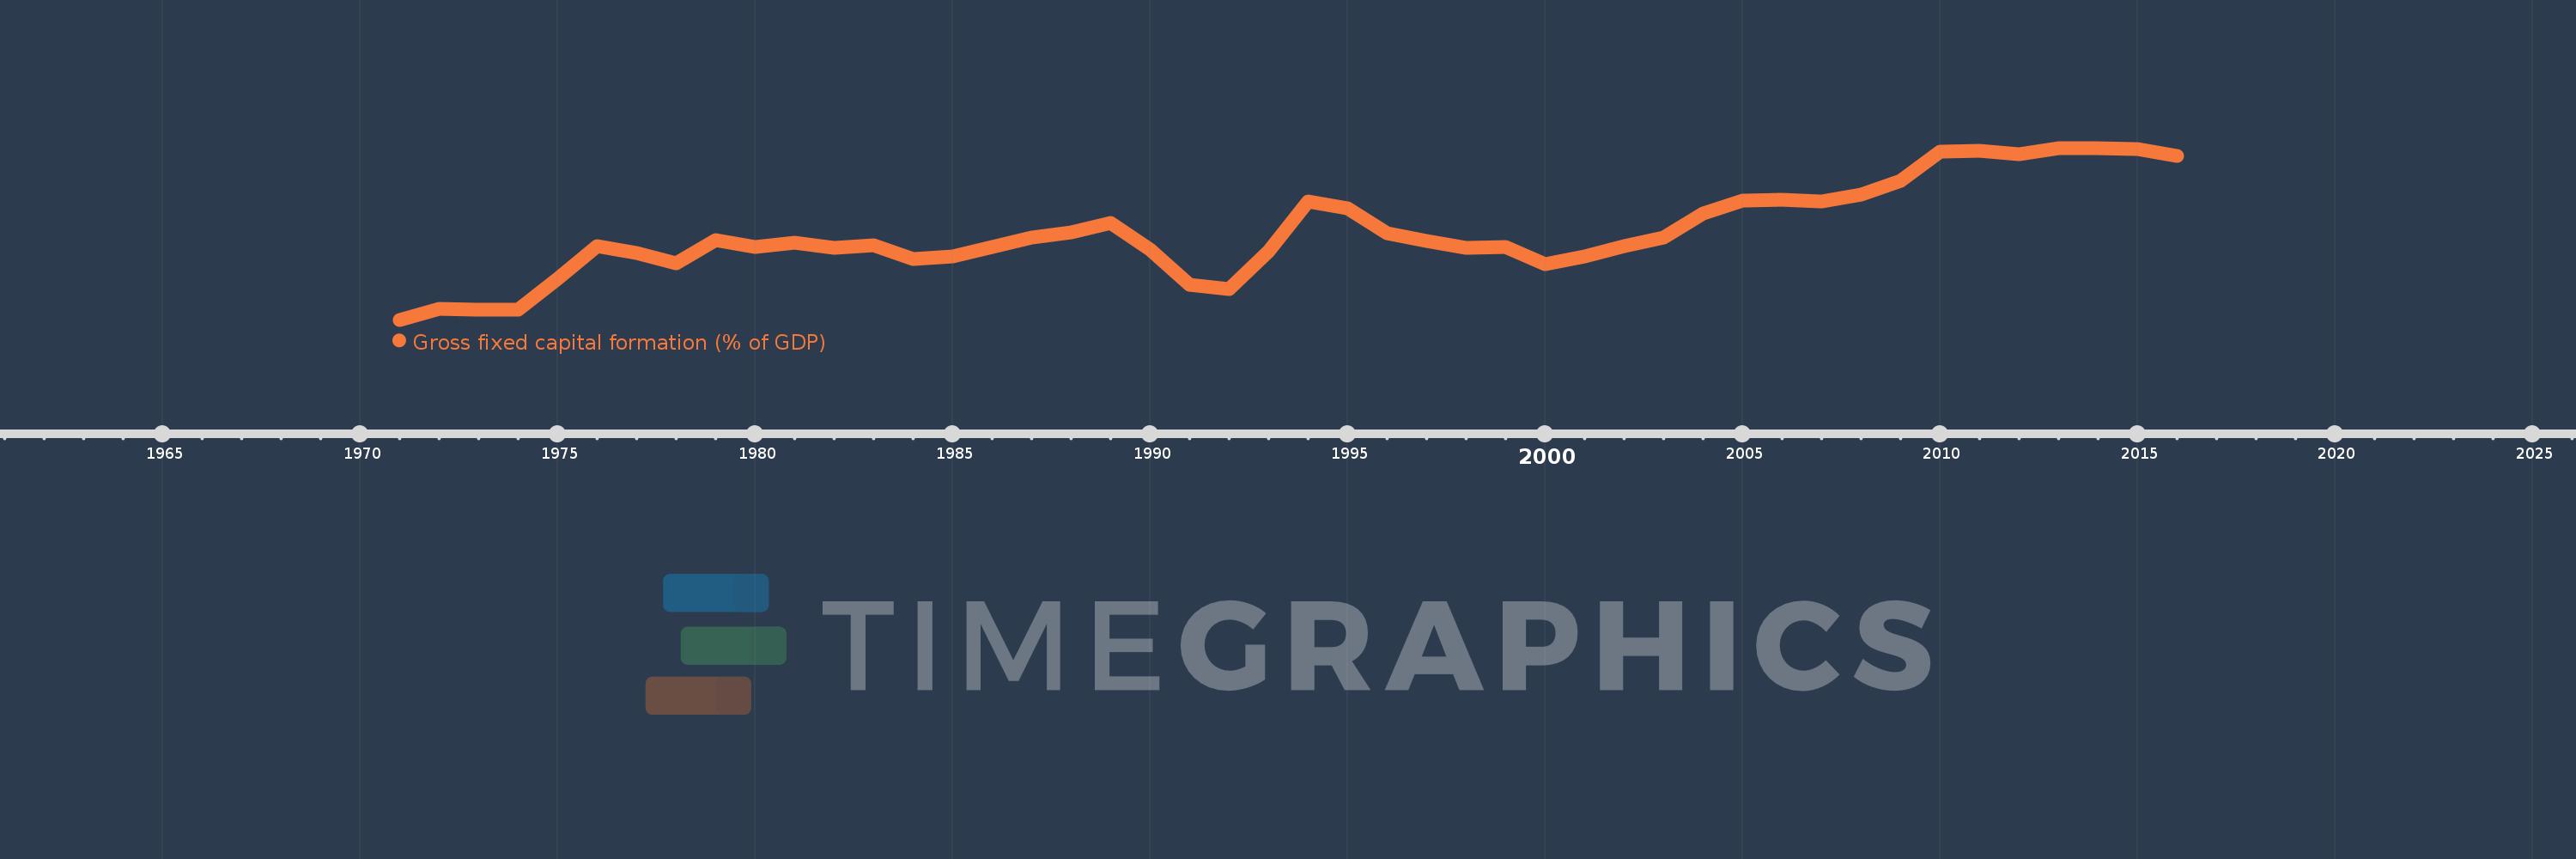
Gross fixed capital formation (% of GDP)
2016,2015,2014,2013,2012,2011,2010,2009,2008,2007,2006,2005,2004,2003,2002,2001,2000,1999,1998,1997,1996,1995,1994,1993,1992,1991,1990,1989,1988,1987,1986,1985,1984,1983,1982,1981,1980,1979,1978,1977,1976,1975,1974,1973,1972,1971
This statistics in other country:
AfghanistanAlbaniaAlgeriaAngolaAntigua and BarbudaArab WorldArgentinaArmeniaArubaAustraliaAustriaAzerbaijanBahamas, TheBahrainBangladeshBarbadosBelarusBelgiumBelizeBeninBermudaBhutanBoliviaBosnia and HerzegovinaBotswanaBrazilBrunei DarussalamBulgariaBurkina FasoBurundiCabo VerdeCambodiaCameroonCanadaCaribbean small statesCentral African RepublicCentral Europe and the BalticsChadChileChinaColombiaComorosCongo, Dem. Rep.Congo, Rep.Costa RicaCote d'IvoireCroatiaCubaCyprusCzech RepublicDenmarkDjiboutiDominicaDominican RepublicEarly-demographic dividendEast Asia & PacificEast Asia & Pacific (excluding high income)East Asia & Pacific (IDA & IBRD countries)EcuadorEgypt, Arab Rep.El SalvadorEquatorial GuineaEritreaEstoniaEthiopiaEuro areaEurope & Central AsiaEurope & Central Asia (excluding high income)Europe & Central Asia (IDA & IBRD countries)European UnionFijiFinlandFragile and conflict affected situationsFranceGabonGambia, TheGeorgiaGermanyGhanaGreeceGrenadaGuatemalaGuineaGuinea-BissauGuyanaHaitiHeavily indebted poor countries (HIPC)High incomeHondurasHong Kong SAR, ChinaHungaryIBRD onlyIcelandIDA & IBRD totalIDA blendIDA onlyIDA totalIndiaIndonesiaIran, Islamic Rep.IraqIrelandIsraelItalyJamaicaJapanJordanKazakhstanKenyaKiribatiKorea, Rep.KosovoKuwaitKyrgyz RepublicLao PDRLate-demographic dividendLatin America & Caribbean Latin America & Caribbean (excluding high income)Latin America & the Caribbean (IDA & IBRD countries)LatviaLeast developed countries: UN classificationLebanonLesothoLiberiaLibyaLithuaniaLow & middle incomeLow incomeLower middle incomeLuxembourgMacao SAR, ChinaMacedonia, FYRMadagascarMalawiMalaysiaMaldivesMaliMaltaMauritaniaMauritiusMexicoMicronesia, Fed. Sts.Middle East & North AfricaMiddle East & North Africa (excluding high income)Middle East & North Africa (IDA & IBRD countries)Middle incomeMoldovaMongoliaMontenegroMoroccoMozambiqueNamibiaNepalNetherlandsNew CaledoniaNew ZealandNicaraguaNigerNigeriaNorth AmericaNorwayOECD membersOmanPacific island small statesPakistanPanamaPapua New GuineaParaguayPeruPhilippinesPolandPortugalPost-demographic dividendPre-demographic dividendPuerto RicoRomaniaRussian FederationRwandaSaudi ArabiaSenegalSerbiaSeychellesSierra LeoneSingaporeSlovak RepublicSloveniaSolomon IslandsSomaliaSouth AfricaSouth AsiaSouth Asia (IDA & IBRD)South SudanSpainSri LankaSt. Kitts and NevisSt. LuciaSt. Vincent and the GrenadinesSub-Saharan Africa Sub-Saharan Africa (excluding high income)Sub-Saharan Africa (IDA & IBRD countries)SudanSurinameSwazilandSwedenSwitzerlandSyrian Arab RepublicTajikistanTanzaniaThailandTimor-LesteTogoTongaTrinidad and TobagoTunisiaTurkeyTurkmenistanUgandaUkraineUnited Arab EmiratesUnited KingdomUnited StatesUpper middle incomeUruguayUzbekistanVanuatuVenezuela, RBVietnamWest Bank and GazaWorldYemen, Rep.ZambiaZimbabwe Timeline:
This timeline shows a graph from 1971 to 2016 of Late-demographic dividend. No data until 1970. Number of actual observations by date: 46.
Source name:
World Development Indicators
Source organization:
World Bank national accounts data, and OECD National Accounts data files.
Categories, topics:
Economy & Growth
Last updated:
apr 23, 2017
Indicators value changes by year
Minimum:
22.077
jan 1, 1971
Maximum:
32.851
jan 1, 2013
At the date of observation
Value
Absolute change
Change from previous value
jan 1, 1971
22.077
+22.077
0.0%
jan 1, 1972
22.783
+0.706
3.2%
jan 1, 1973
22.698
-0.085
-0.37%
jan 1, 1974
22.705
+0.007
0.03%
jan 1, 1975
24.629
+1.924
8.47%
jan 1, 1976
26.673
+2.044
8.3%
jan 1, 1977
26.249
-0.424
-1.59%
jan 1, 1978
25.599
-0.65
-2.48%
jan 1, 1979
27.077
+1.478
5.77%
jan 1, 1980
26.638
-0.438
-1.62%
jan 1, 1981
26.935
+0.297
1.12%
jan 1, 1982
26.567
-0.369
-1.37%
jan 1, 1983
26.724
+0.158
0.59%
jan 1, 1984
25.868
-0.857
-3.21%
jan 1, 1985
26.066
+0.199
0.77%
jan 1, 1986
26.625
+0.559
2.14%
jan 1, 1987
27.24
+0.615
2.31%
jan 1, 1988
27.53
+0.289
1.06%
jan 1, 1989
28.128
+0.598
2.17%
jan 1, 1990
26.501
-1.626
-5.78%
jan 1, 1991
24.253
-2.248
-8.48%
jan 1, 1992
24.024
-0.229
-0.94%
jan 1, 1993
26.385
+2.361
9.83%
jan 1, 1994
29.473
+3.088
11.7%
jan 1, 1995
29.073
-0.4
-1.36%
jan 1, 1996
27.526
-1.547
-5.32%
jan 1, 1997
27.014
-0.512
-1.86%
jan 1, 1998
26.577
-0.437
-1.62%
jan 1, 1999
26.657
+0.08
0.3%
jan 1, 2000
25.538
-1.119
-4.2%
jan 1, 2001
26.059
+0.521
2.04%
jan 1, 2002
26.684
+0.625
2.4%
jan 1, 2003
27.243
+0.559
2.1%
jan 1, 2004
28.74
+1.496
5.49%
jan 1, 2005
29.533
+0.794
2.76%
jan 1, 2006
29.625
+0.091
0.31%
jan 1, 2007
29.503
-0.122
-0.41%
jan 1, 2008
29.938
+0.435
1.48%
jan 1, 2009
30.801
+0.863
2.88%
jan 1, 2010
32.599
+1.798
5.84%
jan 1, 2011
32.674
+0.075
0.23%
jan 1, 2012
32.454
-0.22
-0.67%
jan 1, 2013
32.851
+0.397
1.22%
jan 1, 2014
32.846
-0.005
-0.02%
jan 1, 2015
32.793
-0.053
-0.16%
jan 1, 2016
32.362
-0.431
-1.31%
Ranking of countries by current statistics by years


Comments: