29
/
en
AIzaSyAYiBZKx7MnpbEhh9jyipgxe19OcubqV5w
April 1, 2024
187848
Malaysia
MYS
true
2
1
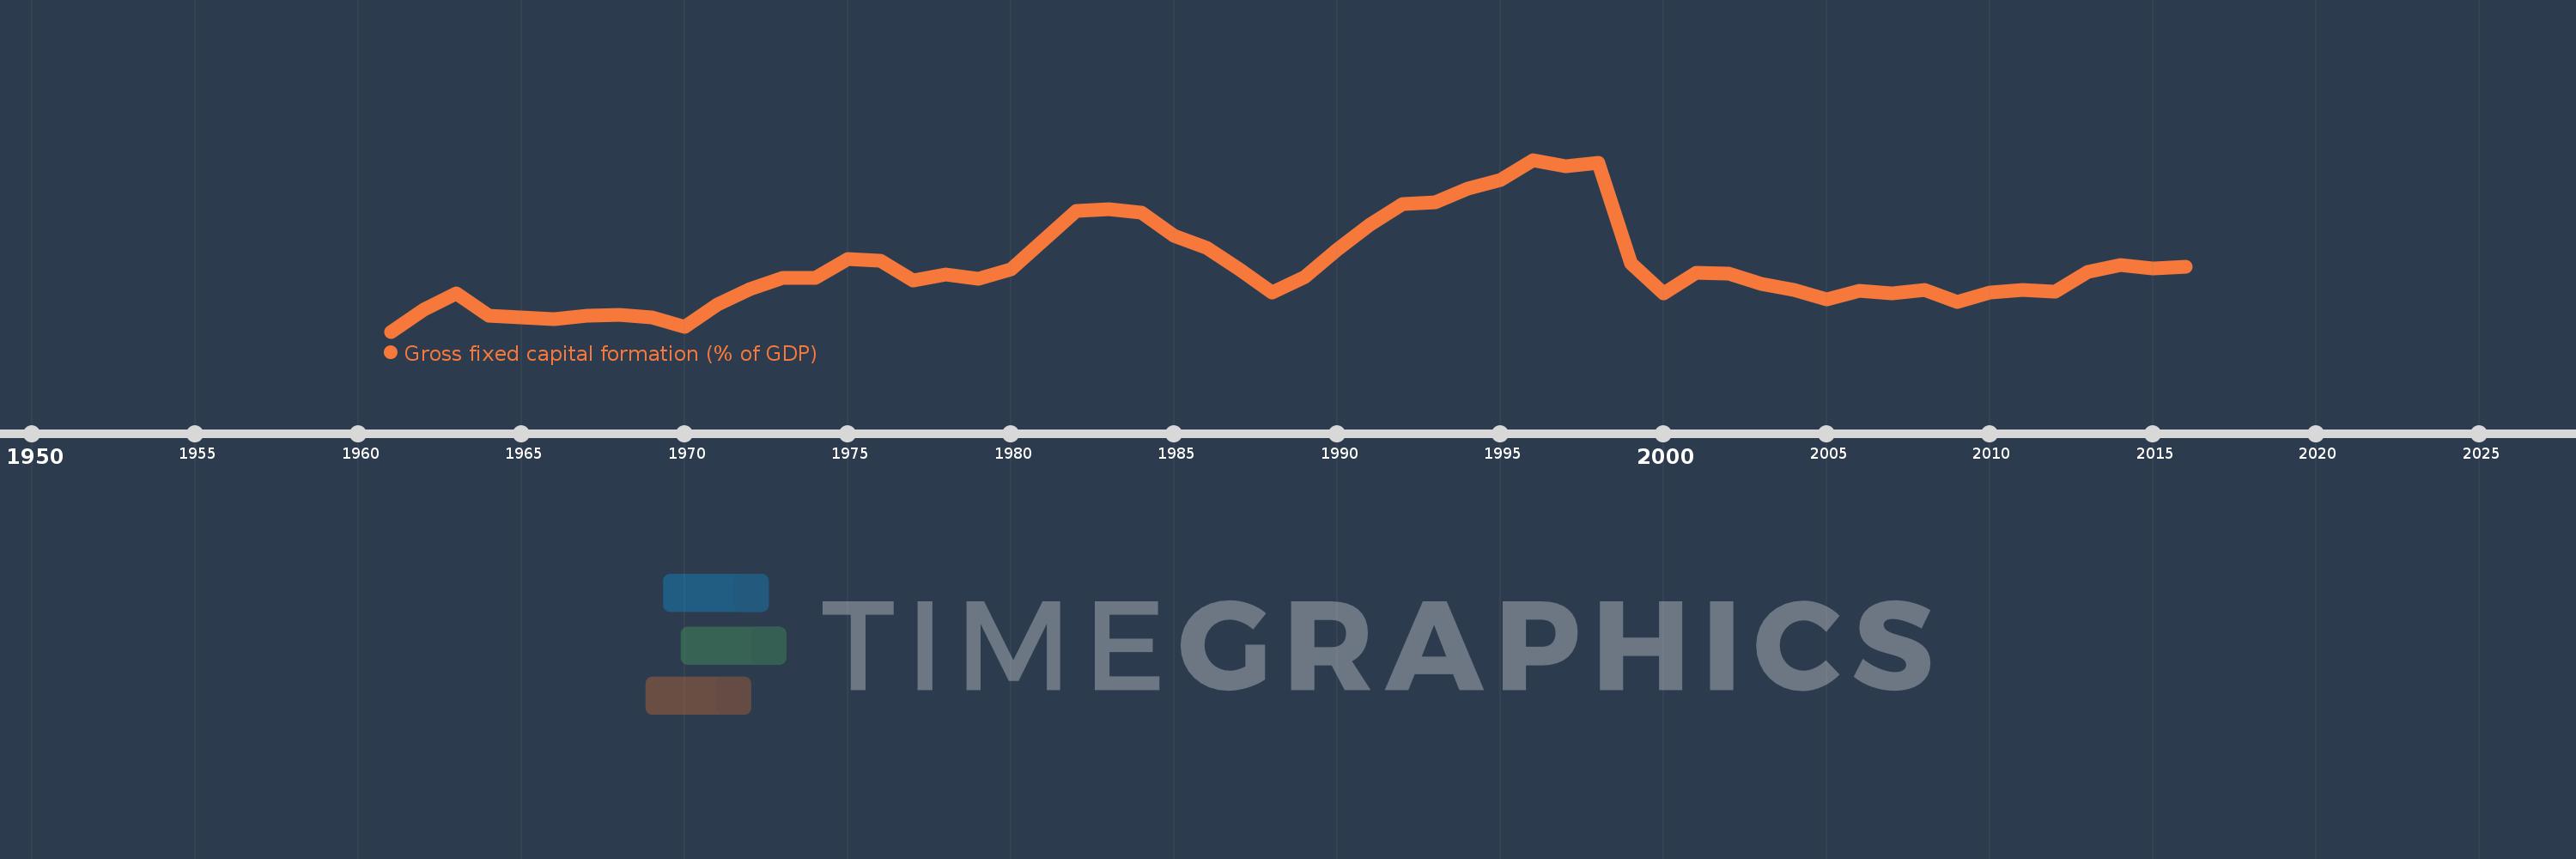
Gross fixed capital formation (% of GDP)
2016,2015,2014,2013,2012,2011,2010,2009,2008,2007,2006,2005,2004,2003,2002,2001,2000,1999,1998,1997,1996,1995,1994,1993,1992,1991,1990,1989,1988,1987,1986,1985,1984,1983,1982,1981,1980,1979,1978,1977,1976,1975,1974,1973,1972,1971,1970,1969,1968,1967,1966,1965,1964,1963,1962,1961
This statistics in other country:
AfghanistanAlbaniaAlgeriaAngolaAntigua and BarbudaArab WorldArgentinaArmeniaArubaAustraliaAustriaAzerbaijanBahamas, TheBahrainBangladeshBarbadosBelarusBelgiumBelizeBeninBermudaBhutanBoliviaBosnia and HerzegovinaBotswanaBrazilBrunei DarussalamBulgariaBurkina FasoBurundiCabo VerdeCambodiaCameroonCanadaCaribbean small statesCentral African RepublicCentral Europe and the BalticsChadChileChinaColombiaComorosCongo, Dem. Rep.Congo, Rep.Costa RicaCote d'IvoireCroatiaCubaCyprusCzech RepublicDenmarkDjiboutiDominicaDominican RepublicEarly-demographic dividendEast Asia & PacificEast Asia & Pacific (excluding high income)East Asia & Pacific (IDA & IBRD countries)EcuadorEgypt, Arab Rep.El SalvadorEquatorial GuineaEritreaEstoniaEthiopiaEuro areaEurope & Central AsiaEurope & Central Asia (excluding high income)Europe & Central Asia (IDA & IBRD countries)European UnionFijiFinlandFragile and conflict affected situationsFranceGabonGambia, TheGeorgiaGermanyGhanaGreeceGrenadaGuatemalaGuineaGuinea-BissauGuyanaHaitiHeavily indebted poor countries (HIPC)High incomeHondurasHong Kong SAR, ChinaHungaryIBRD onlyIcelandIDA & IBRD totalIDA blendIDA onlyIDA totalIndiaIndonesiaIran, Islamic Rep.IraqIrelandIsraelItalyJamaicaJapanJordanKazakhstanKenyaKiribatiKorea, Rep.KosovoKuwaitKyrgyz RepublicLao PDRLate-demographic dividendLatin America & Caribbean Latin America & Caribbean (excluding high income)Latin America & the Caribbean (IDA & IBRD countries)LatviaLeast developed countries: UN classificationLebanonLesothoLiberiaLibyaLithuaniaLow & middle incomeLow incomeLower middle incomeLuxembourgMacao SAR, ChinaMacedonia, FYRMadagascarMalawiMalaysiaMaldivesMaliMaltaMauritaniaMauritiusMexicoMicronesia, Fed. Sts.Middle East & North AfricaMiddle East & North Africa (excluding high income)Middle East & North Africa (IDA & IBRD countries)Middle incomeMoldovaMongoliaMontenegroMoroccoMozambiqueNamibiaNepalNetherlandsNew CaledoniaNew ZealandNicaraguaNigerNigeriaNorth AmericaNorwayOECD membersOmanPacific island small statesPakistanPanamaPapua New GuineaParaguayPeruPhilippinesPolandPortugalPost-demographic dividendPre-demographic dividendPuerto RicoRomaniaRussian FederationRwandaSaudi ArabiaSenegalSerbiaSeychellesSierra LeoneSingaporeSlovak RepublicSloveniaSolomon IslandsSomaliaSouth AfricaSouth AsiaSouth Asia (IDA & IBRD)South SudanSpainSri LankaSt. Kitts and NevisSt. LuciaSt. Vincent and the GrenadinesSub-Saharan Africa Sub-Saharan Africa (excluding high income)Sub-Saharan Africa (IDA & IBRD countries)SudanSurinameSwazilandSwedenSwitzerlandSyrian Arab RepublicTajikistanTanzaniaThailandTimor-LesteTogoTongaTrinidad and TobagoTunisiaTurkeyTurkmenistanUgandaUkraineUnited Arab EmiratesUnited KingdomUnited StatesUpper middle incomeUruguayUzbekistanVanuatuVenezuela, RBVietnamWest Bank and GazaWorldYemen, Rep.ZambiaZimbabwe Timeline:
This timeline shows a graph from 1961 to 2016 of Malaysia. No data until 1960. Number of actual observations by date: 56.
Source name:
World Development Indicators
Source organization:
World Bank national accounts data, and OECD National Accounts data files.
Categories, topics:
Economy & Growth
Last updated:
apr 23, 2017
Indicators value changes by year
Minimum:
15.698
jan 1, 1961
Maximum:
43.586
jan 1, 1996
At the date of observation
Value
Absolute change
Change from previous value
jan 1, 1961
15.698
+15.698
0.0%
jan 1, 1962
19.316
+3.618
23.05%
jan 1, 1963
21.931
+2.615
13.54%
jan 1, 1964
18.28
-3.651
-16.65%
jan 1, 1965
18.035
-0.246
-1.34%
jan 1, 1966
17.738
-0.297
-1.64%
jan 1, 1967
18.239
+0.501
2.82%
jan 1, 1968
18.361
+0.122
0.67%
jan 1, 1969
18.023
-0.338
-1.84%
jan 1, 1970
16.501
-1.521
-8.44%
jan 1, 1971
20.12
+3.619
21.93%
jan 1, 1972
22.598
+2.477
12.31%
jan 1, 1973
24.472
+1.874
8.29%
jan 1, 1974
24.424
-0.048
-0.19%
jan 1, 1975
27.492
+3.067
12.56%
jan 1, 1976
27.187
-0.304
-1.11%
jan 1, 1977
23.951
-3.236
-11.9%
jan 1, 1978
25.019
+1.067
4.46%
jan 1, 1979
24.252
-0.767
-3.07%
jan 1, 1980
25.844
+1.593
6.57%
jan 1, 1981
30.494
+4.649
17.99%
jan 1, 1982
35.291
+4.797
15.73%
jan 1, 1983
35.587
+0.296
0.84%
jan 1, 1984
35.055
-0.532
-1.49%
jan 1, 1985
31.262
-3.794
-10.82%
jan 1, 1986
29.235
-2.027
-6.48%
jan 1, 1987
25.808
-3.427
-11.72%
jan 1, 1988
22.081
-3.727
-14.44%
jan 1, 1989
24.603
+2.523
11.42%
jan 1, 1990
29.077
+4.474
18.19%
jan 1, 1991
33.043
+3.966
13.64%
jan 1, 1992
36.357
+3.313
10.03%
jan 1, 1993
36.628
+0.271
0.75%
jan 1, 1994
38.873
+2.246
6.13%
jan 1, 1995
40.246
+1.372
3.53%
jan 1, 1996
43.586
+3.341
8.3%
jan 1, 1997
42.496
-1.09
-2.5%
jan 1, 1998
43.114
+0.619
1.46%
jan 1, 1999
26.826
-16.289
-37.78%
jan 1, 2000
21.891
-4.935
-18.39%
jan 1, 2001
25.292
+3.401
15.54%
jan 1, 2002
25.123
-0.169
-0.67%
jan 1, 2003
23.484
-1.639
-6.52%
jan 1, 2004
22.414
-1.07
-4.56%
jan 1, 2005
20.955
-1.459
-6.51%
jan 1, 2006
22.304
+1.349
6.44%
jan 1, 2007
21.955
-0.348
-1.56%
jan 1, 2008
22.404
+0.449
2.05%
jan 1, 2009
20.57
-1.834
-8.19%
jan 1, 2010
21.976
+1.406
6.83%
jan 1, 2011
22.435
+0.459
2.09%
jan 1, 2012
22.183
-0.252
-1.12%
jan 1, 2013
25.364
+3.18
14.34%
jan 1, 2014
26.477
+1.114
4.39%
jan 1, 2015
25.976
-0.501
-1.89%
jan 1, 2016
26.181
+0.205
0.79%
Ranking of countries by current statistics by years


Comments: