29
/
en
AIzaSyAYiBZKx7MnpbEhh9jyipgxe19OcubqV5w
April 1, 2024
145723
Guinea
GIN
true
2
1
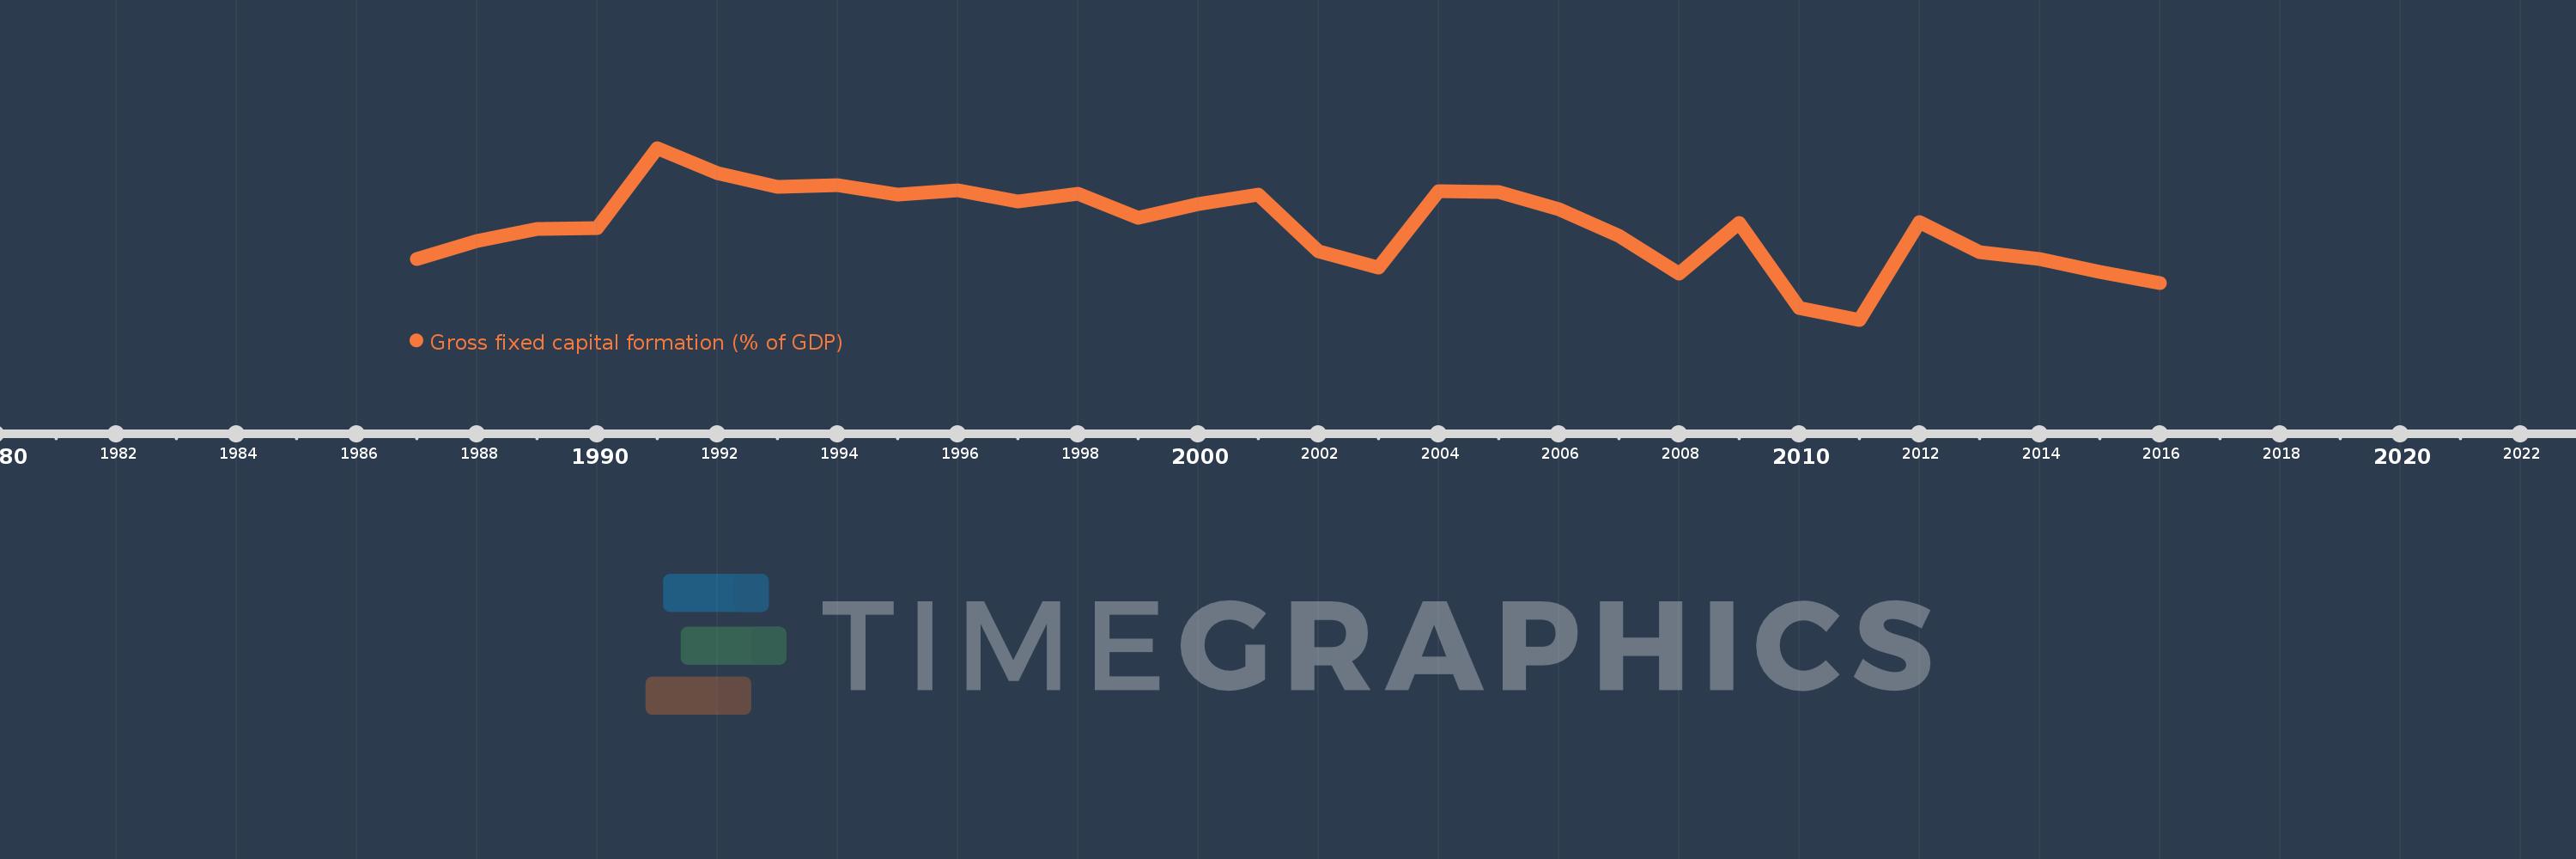
Gross fixed capital formation (% of GDP)
2016,2015,2014,2013,2012,2011,2010,2009,2008,2007,2006,2005,2004,2003,2002,2001,2000,1999,1998,1997,1996,1995,1994,1993,1992,1991,1990,1989,1988,1987
This statistics in other country:
AfghanistanAlbaniaAlgeriaAngolaAntigua and BarbudaArab WorldArgentinaArmeniaArubaAustraliaAustriaAzerbaijanBahamas, TheBahrainBangladeshBarbadosBelarusBelgiumBelizeBeninBermudaBhutanBoliviaBosnia and HerzegovinaBotswanaBrazilBrunei DarussalamBulgariaBurkina FasoBurundiCabo VerdeCambodiaCameroonCanadaCaribbean small statesCentral African RepublicCentral Europe and the BalticsChadChileChinaColombiaComorosCongo, Dem. Rep.Congo, Rep.Costa RicaCote d'IvoireCroatiaCubaCyprusCzech RepublicDenmarkDjiboutiDominicaDominican RepublicEarly-demographic dividendEast Asia & PacificEast Asia & Pacific (excluding high income)East Asia & Pacific (IDA & IBRD countries)EcuadorEgypt, Arab Rep.El SalvadorEquatorial GuineaEritreaEstoniaEthiopiaEuro areaEurope & Central AsiaEurope & Central Asia (excluding high income)Europe & Central Asia (IDA & IBRD countries)European UnionFijiFinlandFragile and conflict affected situationsFranceGabonGambia, TheGeorgiaGermanyGhanaGreeceGrenadaGuatemalaGuineaGuinea-BissauGuyanaHaitiHeavily indebted poor countries (HIPC)High incomeHondurasHong Kong SAR, ChinaHungaryIBRD onlyIcelandIDA & IBRD totalIDA blendIDA onlyIDA totalIndiaIndonesiaIran, Islamic Rep.IraqIrelandIsraelItalyJamaicaJapanJordanKazakhstanKenyaKiribatiKorea, Rep.KosovoKuwaitKyrgyz RepublicLao PDRLate-demographic dividendLatin America & Caribbean Latin America & Caribbean (excluding high income)Latin America & the Caribbean (IDA & IBRD countries)LatviaLeast developed countries: UN classificationLebanonLesothoLiberiaLibyaLithuaniaLow & middle incomeLow incomeLower middle incomeLuxembourgMacao SAR, ChinaMacedonia, FYRMadagascarMalawiMalaysiaMaldivesMaliMaltaMauritaniaMauritiusMexicoMicronesia, Fed. Sts.Middle East & North AfricaMiddle East & North Africa (excluding high income)Middle East & North Africa (IDA & IBRD countries)Middle incomeMoldovaMongoliaMontenegroMoroccoMozambiqueNamibiaNepalNetherlandsNew CaledoniaNew ZealandNicaraguaNigerNigeriaNorth AmericaNorwayOECD membersOmanPacific island small statesPakistanPanamaPapua New GuineaParaguayPeruPhilippinesPolandPortugalPost-demographic dividendPre-demographic dividendPuerto RicoRomaniaRussian FederationRwandaSaudi ArabiaSenegalSerbiaSeychellesSierra LeoneSingaporeSlovak RepublicSloveniaSolomon IslandsSomaliaSouth AfricaSouth AsiaSouth Asia (IDA & IBRD)South SudanSpainSri LankaSt. Kitts and NevisSt. LuciaSt. Vincent and the GrenadinesSub-Saharan Africa Sub-Saharan Africa (excluding high income)Sub-Saharan Africa (IDA & IBRD countries)SudanSurinameSwazilandSwedenSwitzerlandSyrian Arab RepublicTajikistanTanzaniaThailandTimor-LesteTogoTongaTrinidad and TobagoTunisiaTurkeyTurkmenistanUgandaUkraineUnited Arab EmiratesUnited KingdomUnited StatesUpper middle incomeUruguayUzbekistanVanuatuVenezuela, RBVietnamWest Bank and GazaWorldYemen, Rep.ZambiaZimbabwe Timeline:
This timeline shows a graph from 1987 to 2016 of Guinea. No data until 1986. Number of actual observations by date: 30.
Source name:
World Development Indicators
Source organization:
World Bank national accounts data, and OECD National Accounts data files.
Categories, topics:
Economy & Growth
Last updated:
apr 23, 2017
Indicators value changes by year
Minimum:
10.566
jan 1, 2011
Maximum:
22.934
jan 1, 1991
At the date of observation
Value
Absolute change
Change from previous value
jan 1, 1987
14.93
+14.93
0.0%
jan 1, 1988
16.258
+1.328
8.9%
jan 1, 1989
17.087
+0.829
5.1%
jan 1, 1990
17.183
+0.096
0.56%
jan 1, 1991
22.934
+5.751
33.47%
jan 1, 1992
21.107
-1.827
-7.97%
jan 1, 1993
20.133
-0.974
-4.61%
jan 1, 1994
20.273
+0.14
0.7%
jan 1, 1995
19.579
-0.693
-3.42%
jan 1, 1996
19.892
+0.312
1.59%
jan 1, 1997
19.109
-0.783
-3.93%
jan 1, 1998
19.633
+0.524
2.74%
jan 1, 1999
17.879
-1.754
-8.94%
jan 1, 2000
18.91
+1.031
5.77%
jan 1, 2001
19.594
+0.683
3.61%
jan 1, 2002
15.499
-4.095
-20.9%
jan 1, 2003
14.299
-1.2
-7.74%
jan 1, 2004
19.814
+5.515
38.57%
jan 1, 2005
19.746
-0.068
-0.34%
jan 1, 2006
18.555
-1.191
-6.03%
jan 1, 2007
16.633
-1.921
-10.35%
jan 1, 2008
13.869
-2.765
-16.62%
jan 1, 2009
17.515
+3.646
26.29%
jan 1, 2010
11.431
-6.083
-34.73%
jan 1, 2011
10.566
-0.865
-7.57%
jan 1, 2012
17.6
+7.034
66.57%
jan 1, 2013
15.436
-2.164
-12.3%
jan 1, 2014
14.968
-0.468
-3.03%
jan 1, 2015
14.016
-0.952
-6.36%
jan 1, 2016
13.207
-0.809
-5.77%
Ranking of countries by current statistics by years


Comments: