29
/
en
AIzaSyAYiBZKx7MnpbEhh9jyipgxe19OcubqV5w
April 1, 2024
276702
United States
USA
true
2
1
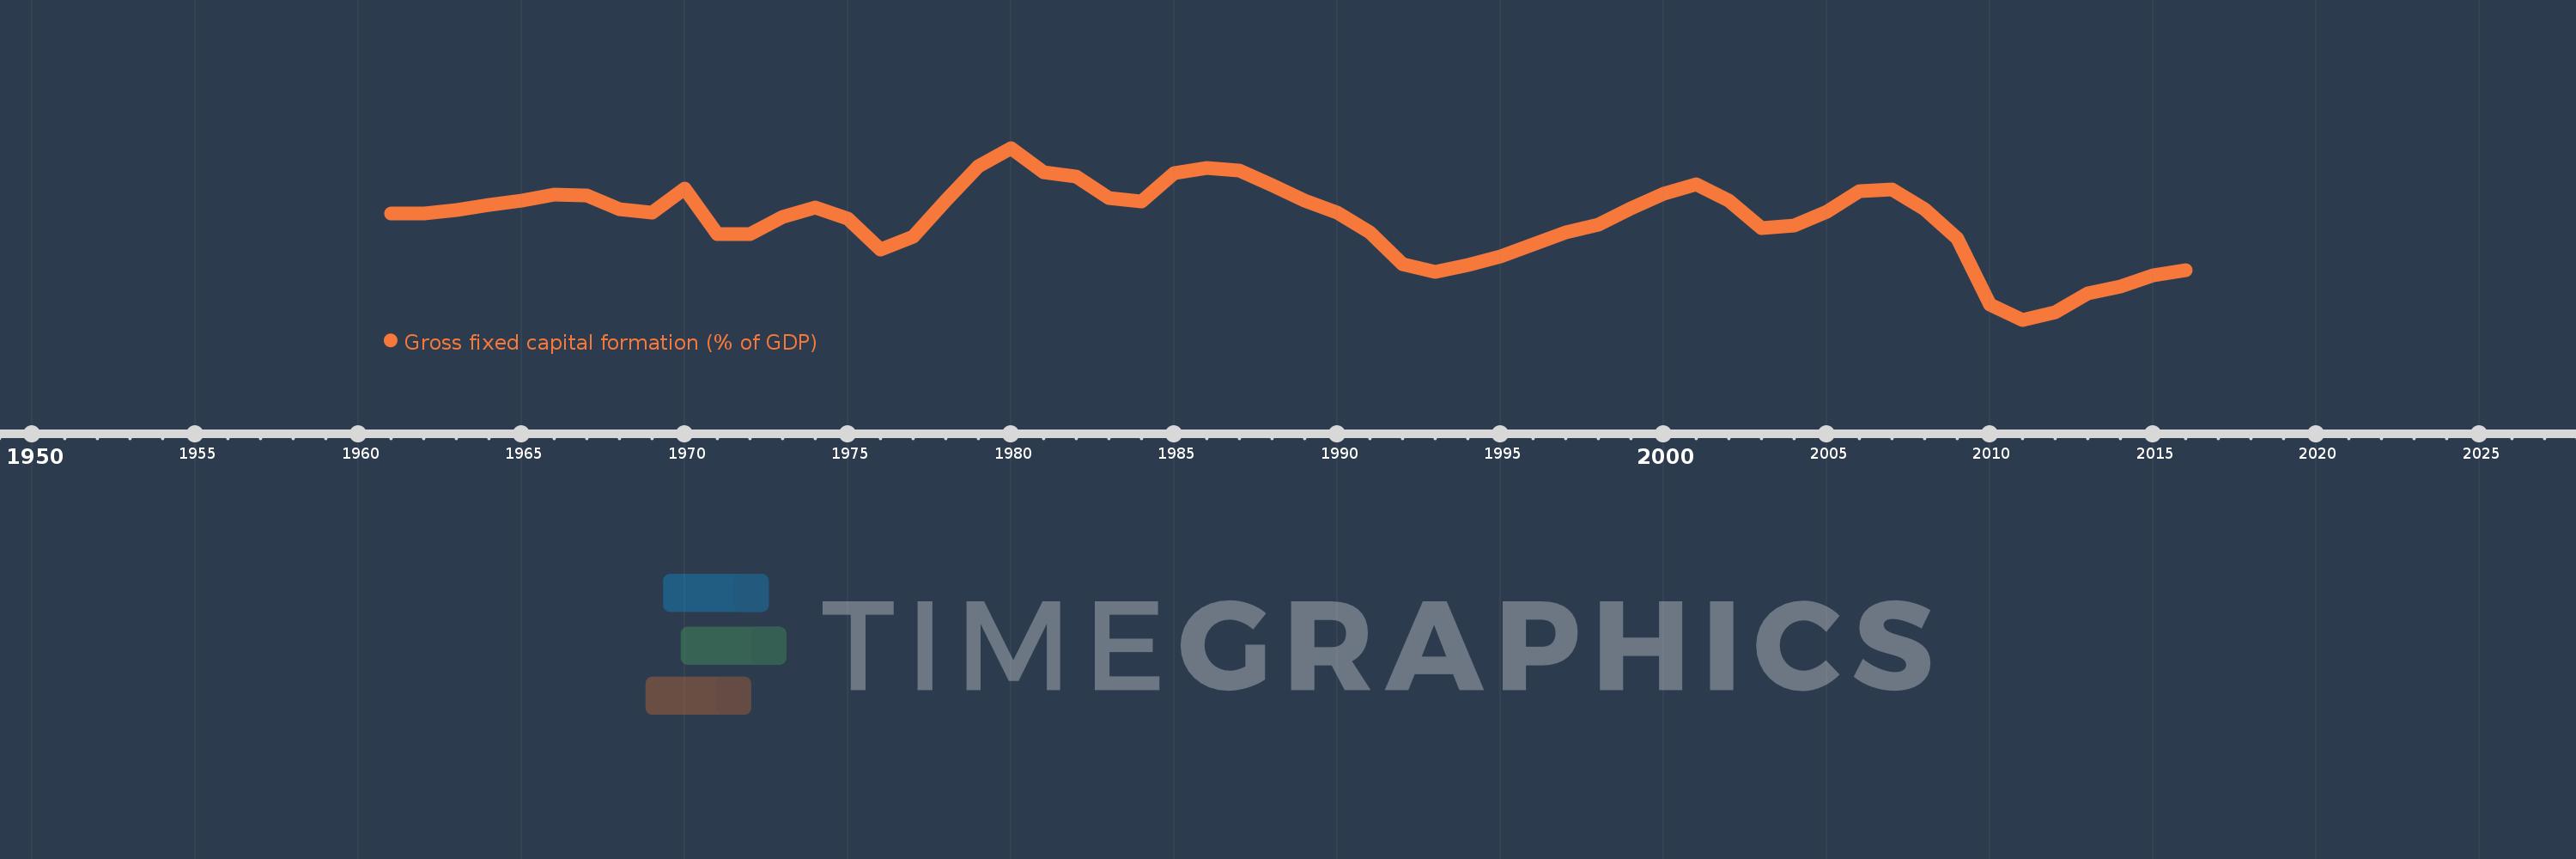
Gross fixed capital formation (% of GDP)
2016,2015,2014,2013,2012,2011,2010,2009,2008,2007,2006,2005,2004,2003,2002,2001,2000,1999,1998,1997,1996,1995,1994,1993,1992,1991,1990,1989,1988,1987,1986,1985,1984,1983,1982,1981,1980,1979,1978,1977,1976,1975,1974,1973,1972,1971,1970,1969,1968,1967,1966,1965,1964,1963,1962,1961
This statistics in other country:
AfghanistanAlbaniaAlgeriaAngolaAntigua and BarbudaArab WorldArgentinaArmeniaArubaAustraliaAustriaAzerbaijanBahamas, TheBahrainBangladeshBarbadosBelarusBelgiumBelizeBeninBermudaBhutanBoliviaBosnia and HerzegovinaBotswanaBrazilBrunei DarussalamBulgariaBurkina FasoBurundiCabo VerdeCambodiaCameroonCanadaCaribbean small statesCentral African RepublicCentral Europe and the BalticsChadChileChinaColombiaComorosCongo, Dem. Rep.Congo, Rep.Costa RicaCote d'IvoireCroatiaCubaCyprusCzech RepublicDenmarkDjiboutiDominicaDominican RepublicEarly-demographic dividendEast Asia & PacificEast Asia & Pacific (excluding high income)East Asia & Pacific (IDA & IBRD countries)EcuadorEgypt, Arab Rep.El SalvadorEquatorial GuineaEritreaEstoniaEthiopiaEuro areaEurope & Central AsiaEurope & Central Asia (excluding high income)Europe & Central Asia (IDA & IBRD countries)European UnionFijiFinlandFragile and conflict affected situationsFranceGabonGambia, TheGeorgiaGermanyGhanaGreeceGrenadaGuatemalaGuineaGuinea-BissauGuyanaHaitiHeavily indebted poor countries (HIPC)High incomeHondurasHong Kong SAR, ChinaHungaryIBRD onlyIcelandIDA & IBRD totalIDA blendIDA onlyIDA totalIndiaIndonesiaIran, Islamic Rep.IraqIrelandIsraelItalyJamaicaJapanJordanKazakhstanKenyaKiribatiKorea, Rep.KosovoKuwaitKyrgyz RepublicLao PDRLate-demographic dividendLatin America & Caribbean Latin America & Caribbean (excluding high income)Latin America & the Caribbean (IDA & IBRD countries)LatviaLeast developed countries: UN classificationLebanonLesothoLiberiaLibyaLithuaniaLow & middle incomeLow incomeLower middle incomeLuxembourgMacao SAR, ChinaMacedonia, FYRMadagascarMalawiMalaysiaMaldivesMaliMaltaMauritaniaMauritiusMexicoMicronesia, Fed. Sts.Middle East & North AfricaMiddle East & North Africa (excluding high income)Middle East & North Africa (IDA & IBRD countries)Middle incomeMoldovaMongoliaMontenegroMoroccoMozambiqueNamibiaNepalNetherlandsNew CaledoniaNew ZealandNicaraguaNigerNigeriaNorth AmericaNorwayOECD membersOmanPacific island small statesPakistanPanamaPapua New GuineaParaguayPeruPhilippinesPolandPortugalPost-demographic dividendPre-demographic dividendPuerto RicoRomaniaRussian FederationRwandaSaudi ArabiaSenegalSerbiaSeychellesSierra LeoneSingaporeSlovak RepublicSloveniaSolomon IslandsSomaliaSouth AfricaSouth AsiaSouth Asia (IDA & IBRD)South SudanSpainSri LankaSt. Kitts and NevisSt. LuciaSt. Vincent and the GrenadinesSub-Saharan Africa Sub-Saharan Africa (excluding high income)Sub-Saharan Africa (IDA & IBRD countries)SudanSurinameSwazilandSwedenSwitzerlandSyrian Arab RepublicTajikistanTanzaniaThailandTimor-LesteTogoTongaTrinidad and TobagoTunisiaTurkeyTurkmenistanUgandaUkraineUnited Arab EmiratesUnited KingdomUnited StatesUpper middle incomeUruguayUzbekistanVanuatuVenezuela, RBVietnamWest Bank and GazaWorldYemen, Rep.ZambiaZimbabwe Timeline:
This timeline shows a graph from 1961 to 2016 of United States. No data until 1960. Number of actual observations by date: 56.
Source name:
World Development Indicators
Source organization:
World Bank national accounts data, and OECD National Accounts data files.
Categories, topics:
Economy & Growth
Last updated:
apr 23, 2017
Indicators value changes by year
Minimum:
17.983
jan 1, 2011
Maximum:
24.382
jan 1, 1980
At the date of observation
Value
Absolute change
Change from previous value
jan 1, 1961
21.94
+21.94
0.0%
jan 1, 1962
21.942
+0.002
0.01%
jan 1, 1963
22.062
+0.12
0.55%
jan 1, 1964
22.267
+0.205
0.93%
jan 1, 1965
22.412
+0.144
0.65%
jan 1, 1966
22.63
+0.218
0.97%
jan 1, 1967
22.601
-0.029
-0.13%
jan 1, 1968
22.096
-0.505
-2.24%
jan 1, 1969
21.973
-0.122
-0.55%
jan 1, 1970
22.865
+0.892
4.06%
jan 1, 1971
21.177
-1.688
-7.38%
jan 1, 1972
21.158
-0.019
-0.09%
jan 1, 1973
21.812
+0.654
3.09%
jan 1, 1974
22.169
+0.357
1.64%
jan 1, 1975
21.739
-0.43
-1.94%
jan 1, 1976
20.599
-1.14
-5.24%
jan 1, 1977
21.078
+0.478
2.32%
jan 1, 1978
22.409
+1.332
6.32%
jan 1, 1979
23.685
+1.276
5.69%
jan 1, 1980
24.382
+0.697
2.94%
jan 1, 1981
23.489
-0.893
-3.66%
jan 1, 1982
23.319
-0.17
-0.72%
jan 1, 1983
22.508
-0.811
-3.48%
jan 1, 1984
22.386
-0.122
-0.54%
jan 1, 1985
23.458
+1.072
4.79%
jan 1, 1986
23.643
+0.185
0.79%
jan 1, 1987
23.543
-0.1
-0.42%
jan 1, 1988
22.99
-0.553
-2.35%
jan 1, 1989
22.405
-0.585
-2.54%
jan 1, 1990
21.96
-0.445
-1.99%
jan 1, 1991
21.227
-0.733
-3.34%
jan 1, 1992
20.065
-1.162
-5.47%
jan 1, 1993
19.77
-0.295
-1.47%
jan 1, 1994
20.031
+0.262
1.32%
jan 1, 1995
20.344
+0.312
1.56%
jan 1, 1996
20.798
+0.455
2.23%
jan 1, 1997
21.249
+0.451
2.17%
jan 1, 1998
21.539
+0.29
1.37%
jan 1, 1999
22.147
+0.608
2.82%
jan 1, 2000
22.688
+0.541
2.44%
jan 1, 2001
23.039
+0.35
1.54%
jan 1, 2002
22.412
-0.627
-2.72%
jan 1, 2003
21.408
-1.004
-4.48%
jan 1, 2004
21.492
+0.084
0.39%
jan 1, 2005
22.006
+0.514
2.39%
jan 1, 2006
22.768
+0.761
3.46%
jan 1, 2007
22.85
+0.082
0.36%
jan 1, 2008
22.113
-0.736
-3.22%
jan 1, 2009
21.004
-1.11
-5.02%
jan 1, 2010
18.536
-2.467
-11.75%
jan 1, 2011
17.983
-0.553
-2.98%
jan 1, 2012
18.276
+0.292
1.62%
jan 1, 2013
18.968
+0.692
3.79%
jan 1, 2014
19.209
+0.241
1.27%
jan 1, 2015
19.637
+0.429
2.23%
jan 1, 2016
19.83
+0.193
0.98%
Ranking of countries by current statistics by years


Comments: