29
/
en
AIzaSyAYiBZKx7MnpbEhh9jyipgxe19OcubqV5w
April 1, 2024
160547
Israel
ISR
true
2
1
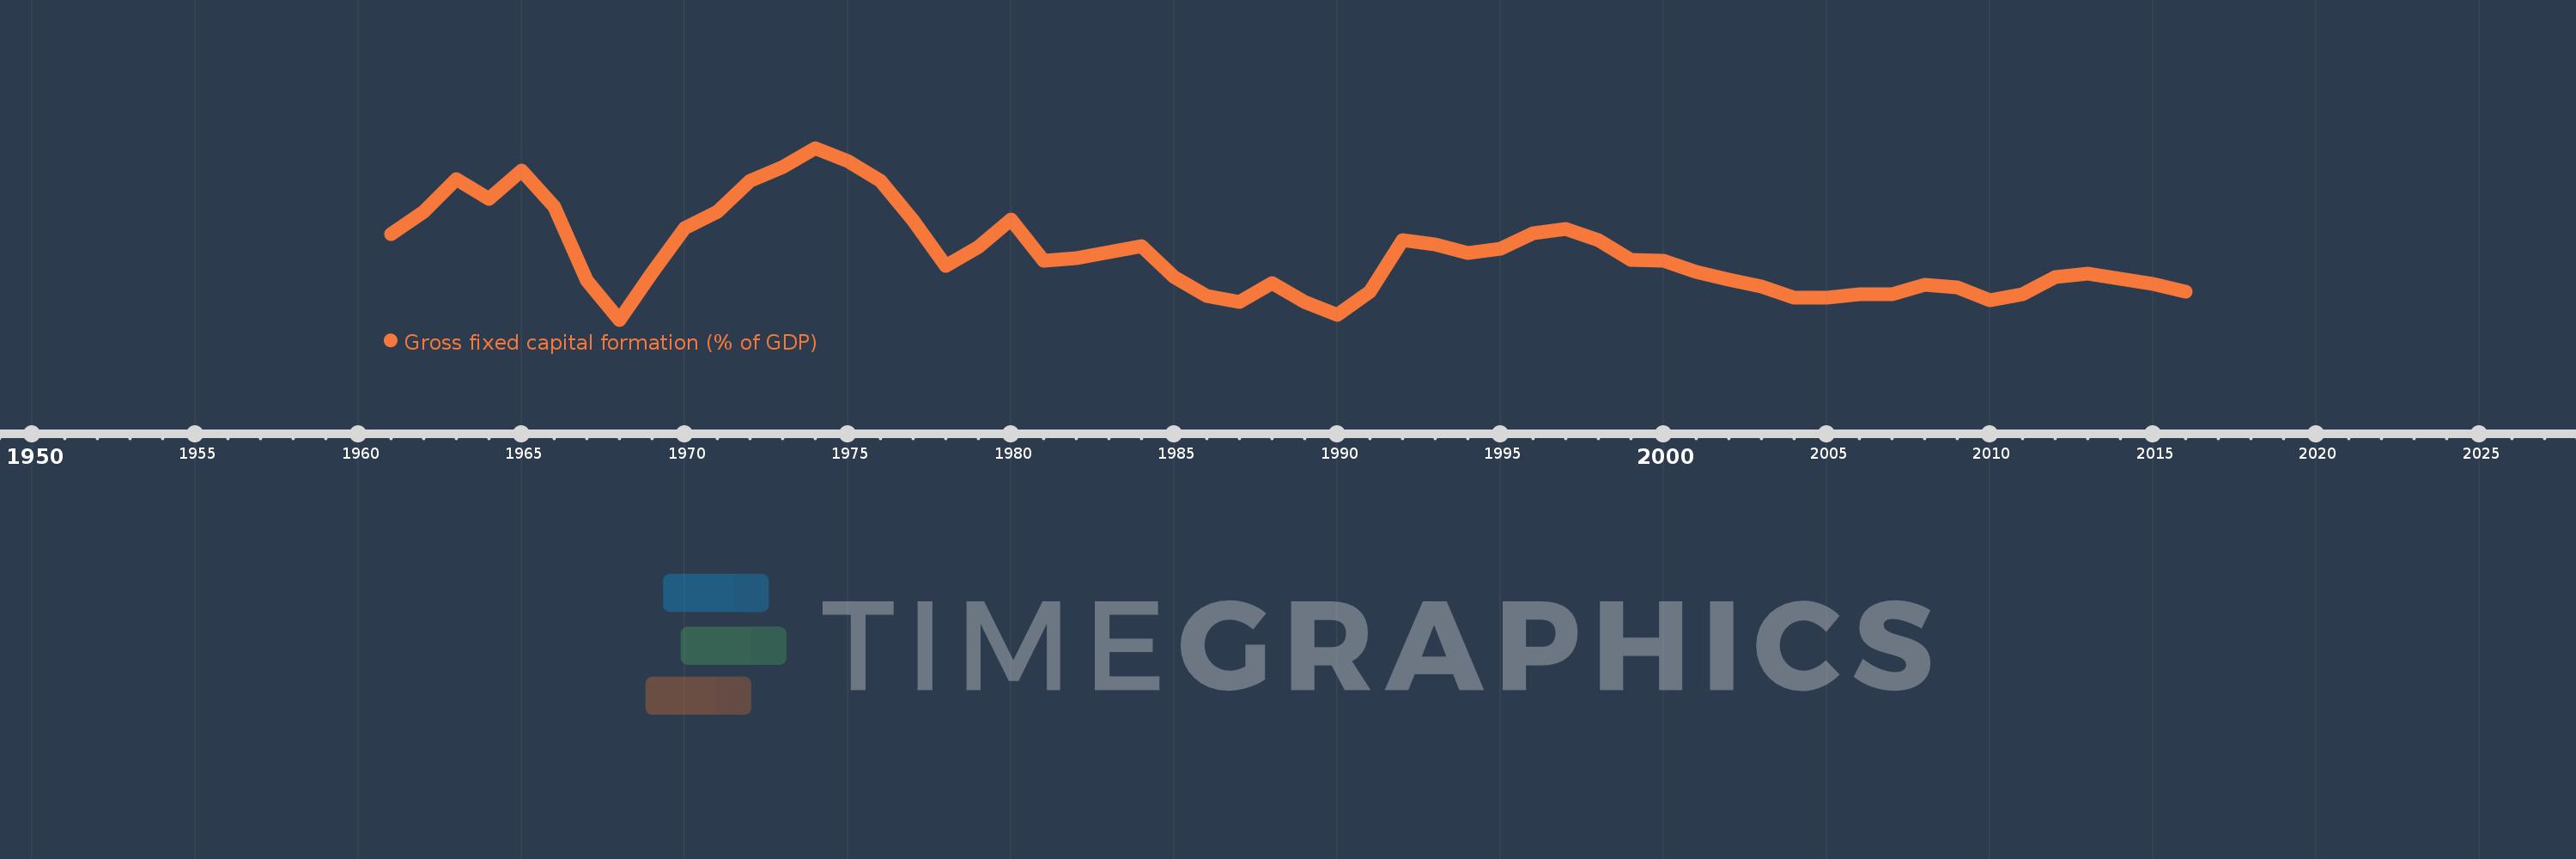
Gross fixed capital formation (% of GDP)
2016,2015,2014,2013,2012,2011,2010,2009,2008,2007,2006,2005,2004,2003,2002,2001,2000,1999,1998,1997,1996,1995,1994,1993,1992,1991,1990,1989,1988,1987,1986,1985,1984,1983,1982,1981,1980,1979,1978,1977,1976,1975,1974,1973,1972,1971,1970,1969,1968,1967,1966,1965,1964,1963,1962,1961
This statistics in other country:
AfghanistanAlbaniaAlgeriaAngolaAntigua and BarbudaArab WorldArgentinaArmeniaArubaAustraliaAustriaAzerbaijanBahamas, TheBahrainBangladeshBarbadosBelarusBelgiumBelizeBeninBermudaBhutanBoliviaBosnia and HerzegovinaBotswanaBrazilBrunei DarussalamBulgariaBurkina FasoBurundiCabo VerdeCambodiaCameroonCanadaCaribbean small statesCentral African RepublicCentral Europe and the BalticsChadChileChinaColombiaComorosCongo, Dem. Rep.Congo, Rep.Costa RicaCote d'IvoireCroatiaCubaCyprusCzech RepublicDenmarkDjiboutiDominicaDominican RepublicEarly-demographic dividendEast Asia & PacificEast Asia & Pacific (excluding high income)East Asia & Pacific (IDA & IBRD countries)EcuadorEgypt, Arab Rep.El SalvadorEquatorial GuineaEritreaEstoniaEthiopiaEuro areaEurope & Central AsiaEurope & Central Asia (excluding high income)Europe & Central Asia (IDA & IBRD countries)European UnionFijiFinlandFragile and conflict affected situationsFranceGabonGambia, TheGeorgiaGermanyGhanaGreeceGrenadaGuatemalaGuineaGuinea-BissauGuyanaHaitiHeavily indebted poor countries (HIPC)High incomeHondurasHong Kong SAR, ChinaHungaryIBRD onlyIcelandIDA & IBRD totalIDA blendIDA onlyIDA totalIndiaIndonesiaIran, Islamic Rep.IraqIrelandIsraelItalyJamaicaJapanJordanKazakhstanKenyaKiribatiKorea, Rep.KosovoKuwaitKyrgyz RepublicLao PDRLate-demographic dividendLatin America & Caribbean Latin America & Caribbean (excluding high income)Latin America & the Caribbean (IDA & IBRD countries)LatviaLeast developed countries: UN classificationLebanonLesothoLiberiaLibyaLithuaniaLow & middle incomeLow incomeLower middle incomeLuxembourgMacao SAR, ChinaMacedonia, FYRMadagascarMalawiMalaysiaMaldivesMaliMaltaMauritaniaMauritiusMexicoMicronesia, Fed. Sts.Middle East & North AfricaMiddle East & North Africa (excluding high income)Middle East & North Africa (IDA & IBRD countries)Middle incomeMoldovaMongoliaMontenegroMoroccoMozambiqueNamibiaNepalNetherlandsNew CaledoniaNew ZealandNicaraguaNigerNigeriaNorth AmericaNorwayOECD membersOmanPacific island small statesPakistanPanamaPapua New GuineaParaguayPeruPhilippinesPolandPortugalPost-demographic dividendPre-demographic dividendPuerto RicoRomaniaRussian FederationRwandaSaudi ArabiaSenegalSerbiaSeychellesSierra LeoneSingaporeSlovak RepublicSloveniaSolomon IslandsSomaliaSouth AfricaSouth AsiaSouth Asia (IDA & IBRD)South SudanSpainSri LankaSt. Kitts and NevisSt. LuciaSt. Vincent and the GrenadinesSub-Saharan Africa Sub-Saharan Africa (excluding high income)Sub-Saharan Africa (IDA & IBRD countries)SudanSurinameSwazilandSwedenSwitzerlandSyrian Arab RepublicTajikistanTanzaniaThailandTimor-LesteTogoTongaTrinidad and TobagoTunisiaTurkeyTurkmenistanUgandaUkraineUnited Arab EmiratesUnited KingdomUnited StatesUpper middle incomeUruguayUzbekistanVanuatuVenezuela, RBVietnamWest Bank and GazaWorldYemen, Rep.ZambiaZimbabwe Timeline:
This timeline shows a graph from 1961 to 2016 of Israel. No data until 1960. Number of actual observations by date: 56.
Source name:
World Development Indicators
Source organization:
World Bank national accounts data, and OECD National Accounts data files.
Categories, topics:
Economy & Growth
Last updated:
apr 23, 2017
Indicators value changes by year
Minimum:
16.543
jan 1, 1968
Maximum:
32.501
jan 1, 1974
At the date of observation
Value
Absolute change
Change from previous value
jan 1, 1961
24.495
+24.495
0.0%
jan 1, 1962
26.605
+2.11
8.61%
jan 1, 1963
29.615
+3.01
11.31%
jan 1, 1964
27.782
-1.833
-6.19%
jan 1, 1965
30.433
+2.651
9.54%
jan 1, 1966
27.025
-3.408
-11.2%
jan 1, 1967
20.159
-6.865
-25.4%
jan 1, 1968
16.543
-3.617
-17.94%
jan 1, 1969
20.928
+4.385
26.51%
jan 1, 1970
25.019
+4.091
19.55%
jan 1, 1971
26.592
+1.573
6.29%
jan 1, 1972
29.478
+2.887
10.86%
jan 1, 1973
30.682
+1.204
4.08%
jan 1, 1974
32.501
+1.819
5.93%
jan 1, 1975
31.281
-1.22
-3.75%
jan 1, 1976
29.423
-1.857
-5.94%
jan 1, 1977
25.789
-3.634
-12.35%
jan 1, 1978
21.543
-4.246
-16.47%
jan 1, 1979
23.331
+1.788
8.3%
jan 1, 1980
25.871
+2.54
10.89%
jan 1, 1981
21.99
-3.881
-15.0%
jan 1, 1982
22.252
+0.263
1.2%
jan 1, 1983
22.808
+0.556
2.5%
jan 1, 1984
23.343
+0.534
2.34%
jan 1, 1985
20.534
-2.808
-12.03%
jan 1, 1986
18.771
-1.763
-8.59%
jan 1, 1987
18.219
-0.553
-2.94%
jan 1, 1988
19.964
+1.745
9.58%
jan 1, 1989
18.204
-1.76
-8.81%
jan 1, 1990
17.028
-1.176
-6.46%
jan 1, 1991
19.119
+2.091
12.28%
jan 1, 1992
23.937
+4.818
25.2%
jan 1, 1993
23.537
-0.4
-1.67%
jan 1, 1994
22.771
-0.766
-3.25%
jan 1, 1995
23.134
+0.363
1.59%
jan 1, 1996
24.602
+1.468
6.35%
jan 1, 1997
24.942
+0.34
1.38%
jan 1, 1998
23.915
-1.028
-4.12%
jan 1, 1999
22.072
-1.843
-7.71%
jan 1, 2000
22.018
-0.053
-0.24%
jan 1, 2001
20.948
-1.07
-4.86%
jan 1, 2002
20.288
-0.66
-3.15%
jan 1, 2003
19.663
-0.625
-3.08%
jan 1, 2004
18.579
-1.084
-5.51%
jan 1, 2005
18.59
+0.011
0.06%
jan 1, 2006
18.895
+0.304
1.64%
jan 1, 2007
18.95
+0.055
0.29%
jan 1, 2008
19.813
+0.864
4.56%
jan 1, 2009
19.58
-0.233
-1.18%
jan 1, 2010
18.376
-1.204
-6.15%
jan 1, 2011
18.943
+0.567
3.09%
jan 1, 2012
20.482
+1.539
8.13%
jan 1, 2013
20.817
+0.334
1.63%
jan 1, 2014
20.341
-0.475
-2.28%
jan 1, 2015
19.863
-0.479
-2.35%
jan 1, 2016
19.145
-0.718
-3.61%
Ranking of countries by current statistics by years


Comments: