29
/
en
AIzaSyAYiBZKx7MnpbEhh9jyipgxe19OcubqV5w
April 1, 2024
96174
Burundi
BDI
true
2
1
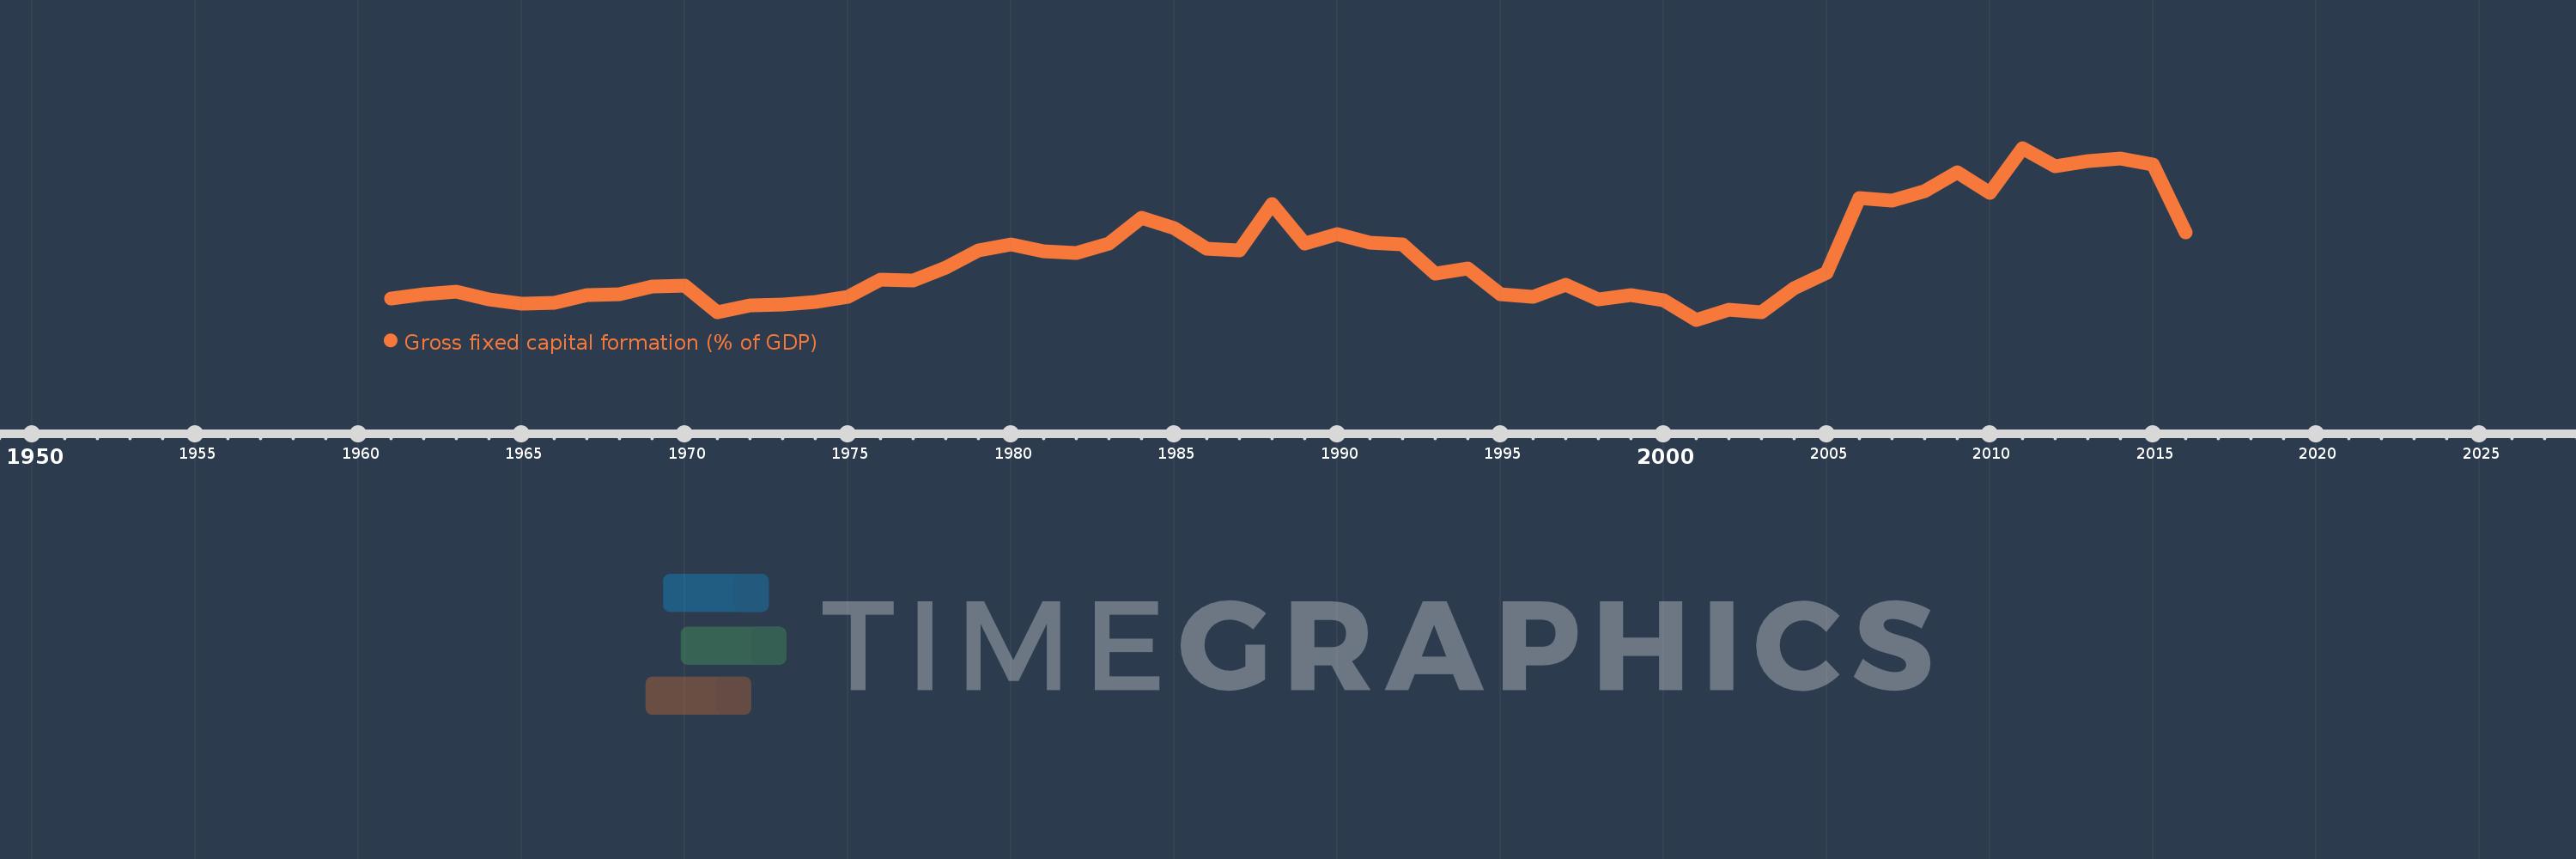
Gross fixed capital formation (% of GDP)
2016,2015,2014,2013,2012,2011,2010,2009,2008,2007,2006,2005,2004,2003,2002,2001,2000,1999,1998,1997,1996,1995,1994,1993,1992,1991,1990,1989,1988,1987,1986,1985,1984,1983,1982,1981,1980,1979,1978,1977,1976,1975,1974,1973,1972,1971,1970,1969,1968,1967,1966,1965,1964,1963,1962,1961
This statistics in other country:
AfghanistanAlbaniaAlgeriaAngolaAntigua and BarbudaArab WorldArgentinaArmeniaArubaAustraliaAustriaAzerbaijanBahamas, TheBahrainBangladeshBarbadosBelarusBelgiumBelizeBeninBermudaBhutanBoliviaBosnia and HerzegovinaBotswanaBrazilBrunei DarussalamBulgariaBurkina FasoBurundiCabo VerdeCambodiaCameroonCanadaCaribbean small statesCentral African RepublicCentral Europe and the BalticsChadChileChinaColombiaComorosCongo, Dem. Rep.Congo, Rep.Costa RicaCote d'IvoireCroatiaCubaCyprusCzech RepublicDenmarkDjiboutiDominicaDominican RepublicEarly-demographic dividendEast Asia & PacificEast Asia & Pacific (excluding high income)East Asia & Pacific (IDA & IBRD countries)EcuadorEgypt, Arab Rep.El SalvadorEquatorial GuineaEritreaEstoniaEthiopiaEuro areaEurope & Central AsiaEurope & Central Asia (excluding high income)Europe & Central Asia (IDA & IBRD countries)European UnionFijiFinlandFragile and conflict affected situationsFranceGabonGambia, TheGeorgiaGermanyGhanaGreeceGrenadaGuatemalaGuineaGuinea-BissauGuyanaHaitiHeavily indebted poor countries (HIPC)High incomeHondurasHong Kong SAR, ChinaHungaryIBRD onlyIcelandIDA & IBRD totalIDA blendIDA onlyIDA totalIndiaIndonesiaIran, Islamic Rep.IraqIrelandIsraelItalyJamaicaJapanJordanKazakhstanKenyaKiribatiKorea, Rep.KosovoKuwaitKyrgyz RepublicLao PDRLate-demographic dividendLatin America & Caribbean Latin America & Caribbean (excluding high income)Latin America & the Caribbean (IDA & IBRD countries)LatviaLeast developed countries: UN classificationLebanonLesothoLiberiaLibyaLithuaniaLow & middle incomeLow incomeLower middle incomeLuxembourgMacao SAR, ChinaMacedonia, FYRMadagascarMalawiMalaysiaMaldivesMaliMaltaMauritaniaMauritiusMexicoMicronesia, Fed. Sts.Middle East & North AfricaMiddle East & North Africa (excluding high income)Middle East & North Africa (IDA & IBRD countries)Middle incomeMoldovaMongoliaMontenegroMoroccoMozambiqueNamibiaNepalNetherlandsNew CaledoniaNew ZealandNicaraguaNigerNigeriaNorth AmericaNorwayOECD membersOmanPacific island small statesPakistanPanamaPapua New GuineaParaguayPeruPhilippinesPolandPortugalPost-demographic dividendPre-demographic dividendPuerto RicoRomaniaRussian FederationRwandaSaudi ArabiaSenegalSerbiaSeychellesSierra LeoneSingaporeSlovak RepublicSloveniaSolomon IslandsSomaliaSouth AfricaSouth AsiaSouth Asia (IDA & IBRD)South SudanSpainSri LankaSt. Kitts and NevisSt. LuciaSt. Vincent and the GrenadinesSub-Saharan Africa Sub-Saharan Africa (excluding high income)Sub-Saharan Africa (IDA & IBRD countries)SudanSurinameSwazilandSwedenSwitzerlandSyrian Arab RepublicTajikistanTanzaniaThailandTimor-LesteTogoTongaTrinidad and TobagoTunisiaTurkeyTurkmenistanUgandaUkraineUnited Arab EmiratesUnited KingdomUnited StatesUpper middle incomeUruguayUzbekistanVanuatuVenezuela, RBVietnamWest Bank and GazaWorldYemen, Rep.ZambiaZimbabwe Timeline:
This timeline shows a graph from 1961 to 2016 of Burundi. No data until 1960. Number of actual observations by date: 56.
Source name:
World Development Indicators
Source organization:
World Bank national accounts data, and OECD National Accounts data files.
Categories, topics:
Economy & Growth
Last updated:
apr 23, 2017
Indicators value changes by year
At the date of observation
Value
Absolute change
Change from previous value
jan 1, 1961
6.25
+6.25
0.0%
jan 1, 1962
6.897
+0.647
10.34%
jan 1, 1963
7.377
+0.48
6.97%
jan 1, 1964
6.015
-1.362
-18.46%
jan 1, 1965
5.369
-0.646
-10.74%
jan 1, 1966
5.54
+0.171
3.18%
jan 1, 1967
6.768
+1.228
22.16%
jan 1, 1968
6.905
+0.138
2.04%
jan 1, 1969
8.212
+1.307
18.92%
jan 1, 1970
8.319
+0.107
1.3%
jan 1, 1971
3.997
-4.322
-51.95%
jan 1, 1972
5.069
+1.072
26.83%
jan 1, 1973
5.265
+0.196
3.87%
jan 1, 1974
5.715
+0.449
8.53%
jan 1, 1975
6.502
+0.788
13.78%
jan 1, 1976
9.257
+2.755
42.37%
jan 1, 1977
9.088
-0.169
-1.82%
jan 1, 1978
11.196
+2.108
23.19%
jan 1, 1979
14.037
+2.84
25.37%
jan 1, 1980
14.916
+0.879
6.26%
jan 1, 1981
13.886
-1.03
-6.91%
jan 1, 1982
13.565
-0.32
-2.31%
jan 1, 1983
15.133
+1.568
11.56%
jan 1, 1984
19.313
+4.18
27.62%
jan 1, 1985
17.588
-1.725
-8.93%
jan 1, 1986
14.305
-3.283
-18.67%
jan 1, 1987
13.98
-0.325
-2.27%
jan 1, 1988
21.515
+7.535
53.9%
jan 1, 1989
15.11
-6.405
-29.77%
jan 1, 1990
16.566
+1.456
9.63%
jan 1, 1991
15.243
-1.323
-7.98%
jan 1, 1992
14.898
-0.345
-2.27%
jan 1, 1993
10.192
-4.705
-31.58%
jan 1, 1994
11.1
+0.908
8.91%
jan 1, 1995
6.951
-4.149
-37.38%
jan 1, 1996
6.443
-0.508
-7.31%
jan 1, 1997
8.365
+1.922
29.83%
jan 1, 1998
6.097
-2.268
-27.12%
jan 1, 1999
6.772
+0.675
11.07%
jan 1, 2000
5.885
-0.887
-13.09%
jan 1, 2001
2.781
-3.104
-52.74%
jan 1, 2002
4.468
+1.687
60.66%
jan 1, 2003
3.949
-0.52
-11.63%
jan 1, 2004
7.869
+3.92
99.28%
jan 1, 2005
10.347
+2.478
31.5%
jan 1, 2006
22.373
+12.026
116.22%
jan 1, 2007
21.955
-0.417
-1.87%
jan 1, 2008
23.607
+1.651
7.52%
jan 1, 2009
26.664
+3.057
12.95%
jan 1, 2010
23.248
-3.416
-12.81%
jan 1, 2011
30.52
+7.272
31.28%
jan 1, 2012
27.589
-2.931
-9.6%
jan 1, 2013
28.373
+0.784
2.84%
jan 1, 2014
28.745
+0.372
1.31%
jan 1, 2015
27.813
-0.933
-3.24%
jan 1, 2016
16.892
-10.921
-39.27%
Ranking of countries by current statistics by years


Comments: