29
/
en
AIzaSyAYiBZKx7MnpbEhh9jyipgxe19OcubqV5w
April 1, 2024
146894
Guinea-Bissau
GNB
true
2
1
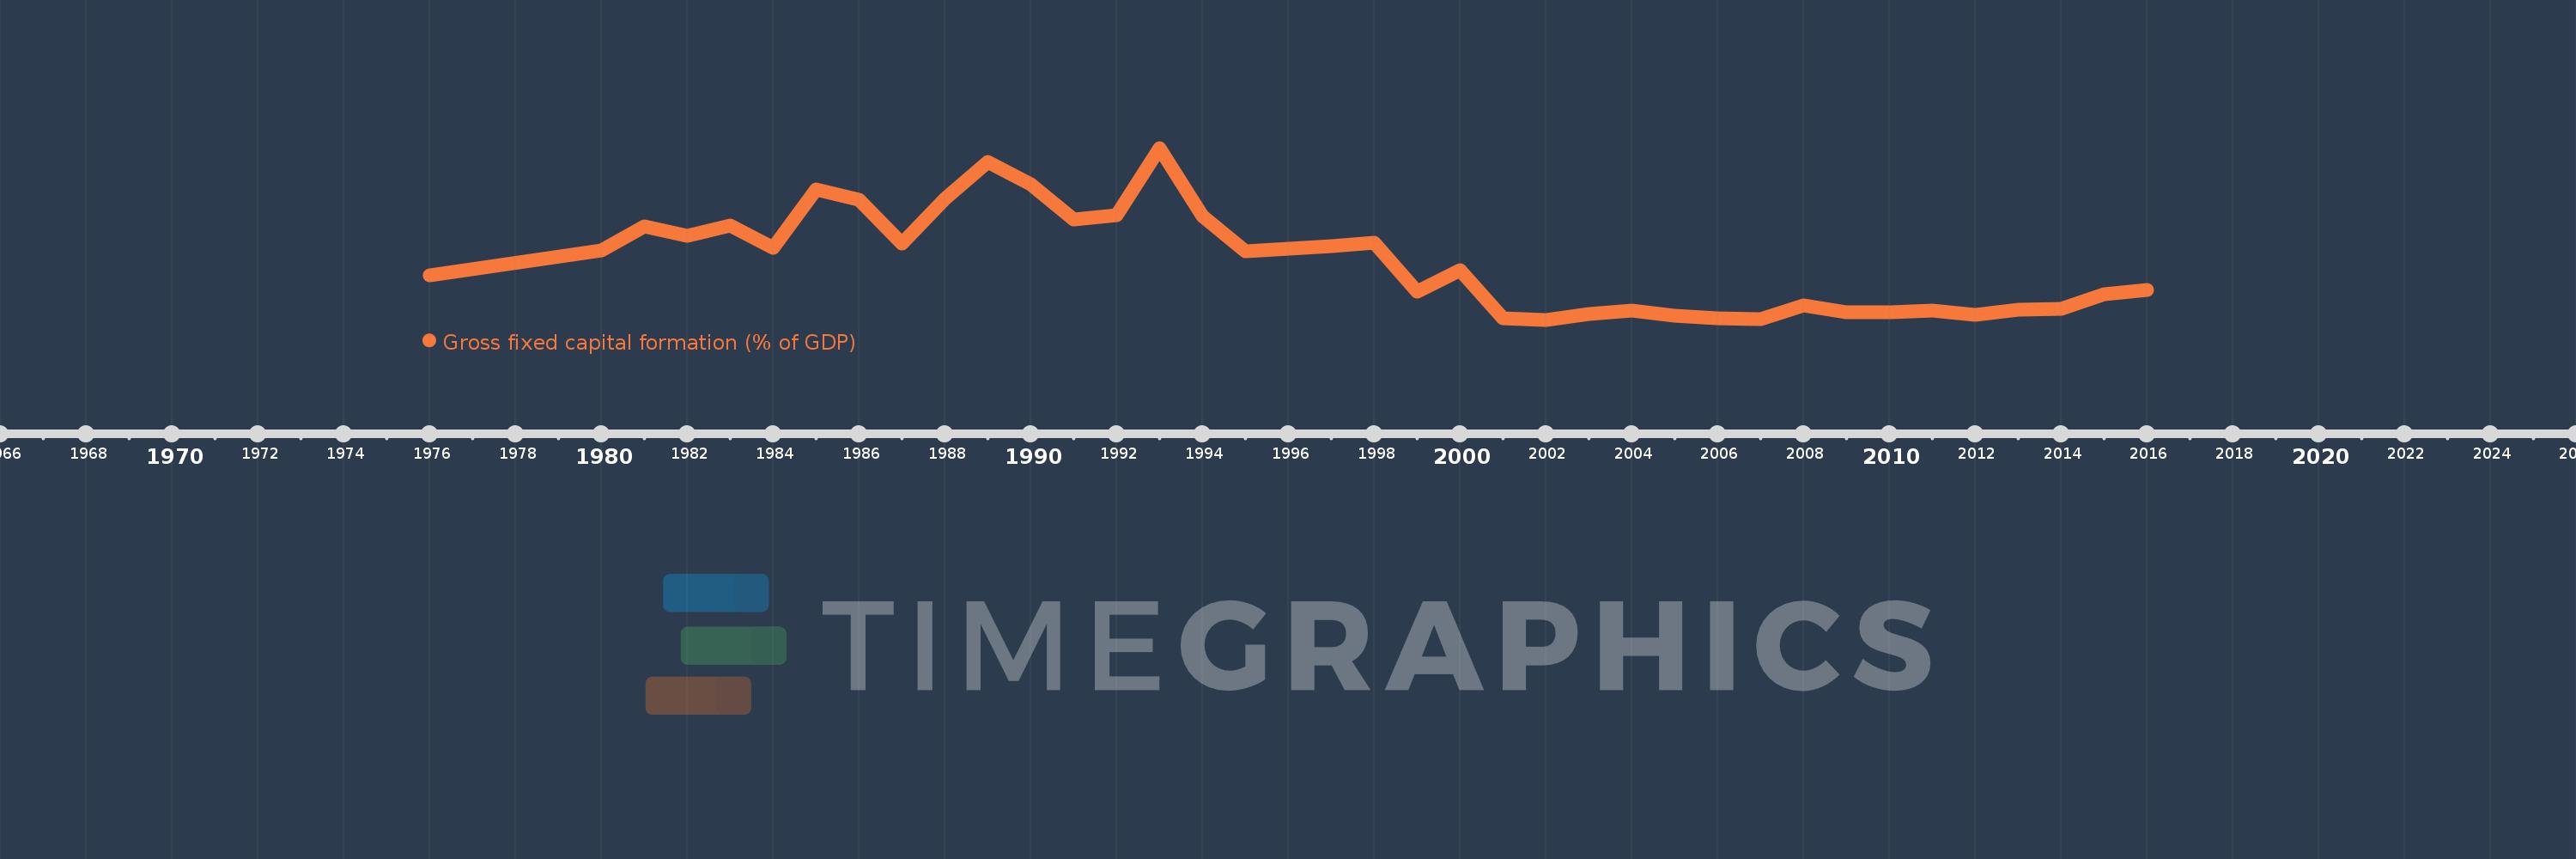
Gross fixed capital formation (% of GDP)
2016,2015,2014,2013,2012,2011,2010,2009,2008,2007,2006,2005,2004,2003,2002,2001,2000,1999,1998,1997,1996,1995,1994,1993,1992,1991,1990,1989,1988,1987,1986,1985,1984,1983,1982,1981,1980,1976
This statistics in other country:
AfghanistanAlbaniaAlgeriaAngolaAntigua and BarbudaArab WorldArgentinaArmeniaArubaAustraliaAustriaAzerbaijanBahamas, TheBahrainBangladeshBarbadosBelarusBelgiumBelizeBeninBermudaBhutanBoliviaBosnia and HerzegovinaBotswanaBrazilBrunei DarussalamBulgariaBurkina FasoBurundiCabo VerdeCambodiaCameroonCanadaCaribbean small statesCentral African RepublicCentral Europe and the BalticsChadChileChinaColombiaComorosCongo, Dem. Rep.Congo, Rep.Costa RicaCote d'IvoireCroatiaCubaCyprusCzech RepublicDenmarkDjiboutiDominicaDominican RepublicEarly-demographic dividendEast Asia & PacificEast Asia & Pacific (excluding high income)East Asia & Pacific (IDA & IBRD countries)EcuadorEgypt, Arab Rep.El SalvadorEquatorial GuineaEritreaEstoniaEthiopiaEuro areaEurope & Central AsiaEurope & Central Asia (excluding high income)Europe & Central Asia (IDA & IBRD countries)European UnionFijiFinlandFragile and conflict affected situationsFranceGabonGambia, TheGeorgiaGermanyGhanaGreeceGrenadaGuatemalaGuineaGuinea-BissauGuyanaHaitiHeavily indebted poor countries (HIPC)High incomeHondurasHong Kong SAR, ChinaHungaryIBRD onlyIcelandIDA & IBRD totalIDA blendIDA onlyIDA totalIndiaIndonesiaIran, Islamic Rep.IraqIrelandIsraelItalyJamaicaJapanJordanKazakhstanKenyaKiribatiKorea, Rep.KosovoKuwaitKyrgyz RepublicLao PDRLate-demographic dividendLatin America & Caribbean Latin America & Caribbean (excluding high income)Latin America & the Caribbean (IDA & IBRD countries)LatviaLeast developed countries: UN classificationLebanonLesothoLiberiaLibyaLithuaniaLow & middle incomeLow incomeLower middle incomeLuxembourgMacao SAR, ChinaMacedonia, FYRMadagascarMalawiMalaysiaMaldivesMaliMaltaMauritaniaMauritiusMexicoMicronesia, Fed. Sts.Middle East & North AfricaMiddle East & North Africa (excluding high income)Middle East & North Africa (IDA & IBRD countries)Middle incomeMoldovaMongoliaMontenegroMoroccoMozambiqueNamibiaNepalNetherlandsNew CaledoniaNew ZealandNicaraguaNigerNigeriaNorth AmericaNorwayOECD membersOmanPacific island small statesPakistanPanamaPapua New GuineaParaguayPeruPhilippinesPolandPortugalPost-demographic dividendPre-demographic dividendPuerto RicoRomaniaRussian FederationRwandaSaudi ArabiaSenegalSerbiaSeychellesSierra LeoneSingaporeSlovak RepublicSloveniaSolomon IslandsSomaliaSouth AfricaSouth AsiaSouth Asia (IDA & IBRD)South SudanSpainSri LankaSt. Kitts and NevisSt. LuciaSt. Vincent and the GrenadinesSub-Saharan Africa Sub-Saharan Africa (excluding high income)Sub-Saharan Africa (IDA & IBRD countries)SudanSurinameSwazilandSwedenSwitzerlandSyrian Arab RepublicTajikistanTanzaniaThailandTimor-LesteTogoTongaTrinidad and TobagoTunisiaTurkeyTurkmenistanUgandaUkraineUnited Arab EmiratesUnited KingdomUnited StatesUpper middle incomeUruguayUzbekistanVanuatuVenezuela, RBVietnamWest Bank and GazaWorldYemen, Rep.ZambiaZimbabwe Timeline:
This timeline shows a graph from 1976 to 2016 of Guinea-Bissau. No data until 1975. Number of actual observations by date: 38.
Source name:
World Development Indicators
Source organization:
World Bank national accounts data, and OECD National Accounts data files.
Categories, topics:
Economy & Growth
Last updated:
apr 23, 2017
Indicators value changes by year
Maximum:
48.397
jan 1, 1993
At the date of observation
Value
Absolute change
Change from previous value
jan 1, 1976
15.397
+15.397
0.0%
jan 1, 1980
21.837
+6.44
41.82%
jan 1, 1981
28.181
+6.344
29.05%
jan 1, 1982
25.746
-2.435
-8.64%
jan 1, 1983
28.26
+2.514
9.76%
jan 1, 1984
22.662
-5.598
-19.81%
jan 1, 1985
37.725
+15.063
66.47%
jan 1, 1986
35.1
-2.624
-6.96%
jan 1, 1987
23.78
-11.32
-32.25%
jan 1, 1988
35.214
+11.435
48.09%
jan 1, 1989
44.701
+9.487
26.94%
jan 1, 1990
38.982
-5.719
-12.79%
jan 1, 1991
29.926
-9.056
-23.23%
jan 1, 1992
30.989
+1.064
3.55%
jan 1, 1993
48.397
+17.407
56.17%
jan 1, 1994
30.857
-17.539
-36.24%
jan 1, 1995
21.771
-9.087
-29.45%
jan 1, 1996
22.301
+0.53
2.44%
jan 1, 1997
23.052
+0.751
3.37%
jan 1, 1998
23.999
+0.947
4.11%
jan 1, 1999
11.335
-12.664
-52.77%
jan 1, 2000
16.8
+5.465
48.21%
jan 1, 2001
4.375
-12.425
-73.96%
jan 1, 2002
4.007
-0.368
-8.42%
jan 1, 2003
5.505
+1.497
37.37%
jan 1, 2004
6.387
+0.883
16.04%
jan 1, 2005
4.989
-1.399
-21.9%
jan 1, 2006
4.28
-0.709
-14.21%
jan 1, 2007
4.155
-0.125
-2.91%
jan 1, 2008
7.732
+3.577
86.08%
jan 1, 2009
6.009
-1.723
-22.29%
jan 1, 2010
5.947
-0.061
-1.02%
jan 1, 2011
6.47
+0.523
8.79%
jan 1, 2012
5.226
-1.245
-19.24%
jan 1, 2013
6.494
+1.269
24.28%
jan 1, 2014
6.921
+0.427
6.57%
jan 1, 2015
10.683
+3.762
54.35%
jan 1, 2016
11.755
+1.072
10.03%
Ranking of countries by current statistics by years


Comments: