29
/
en
AIzaSyAYiBZKx7MnpbEhh9jyipgxe19OcubqV5w
April 1, 2024
195609
Mexico
MEX
true
2
1
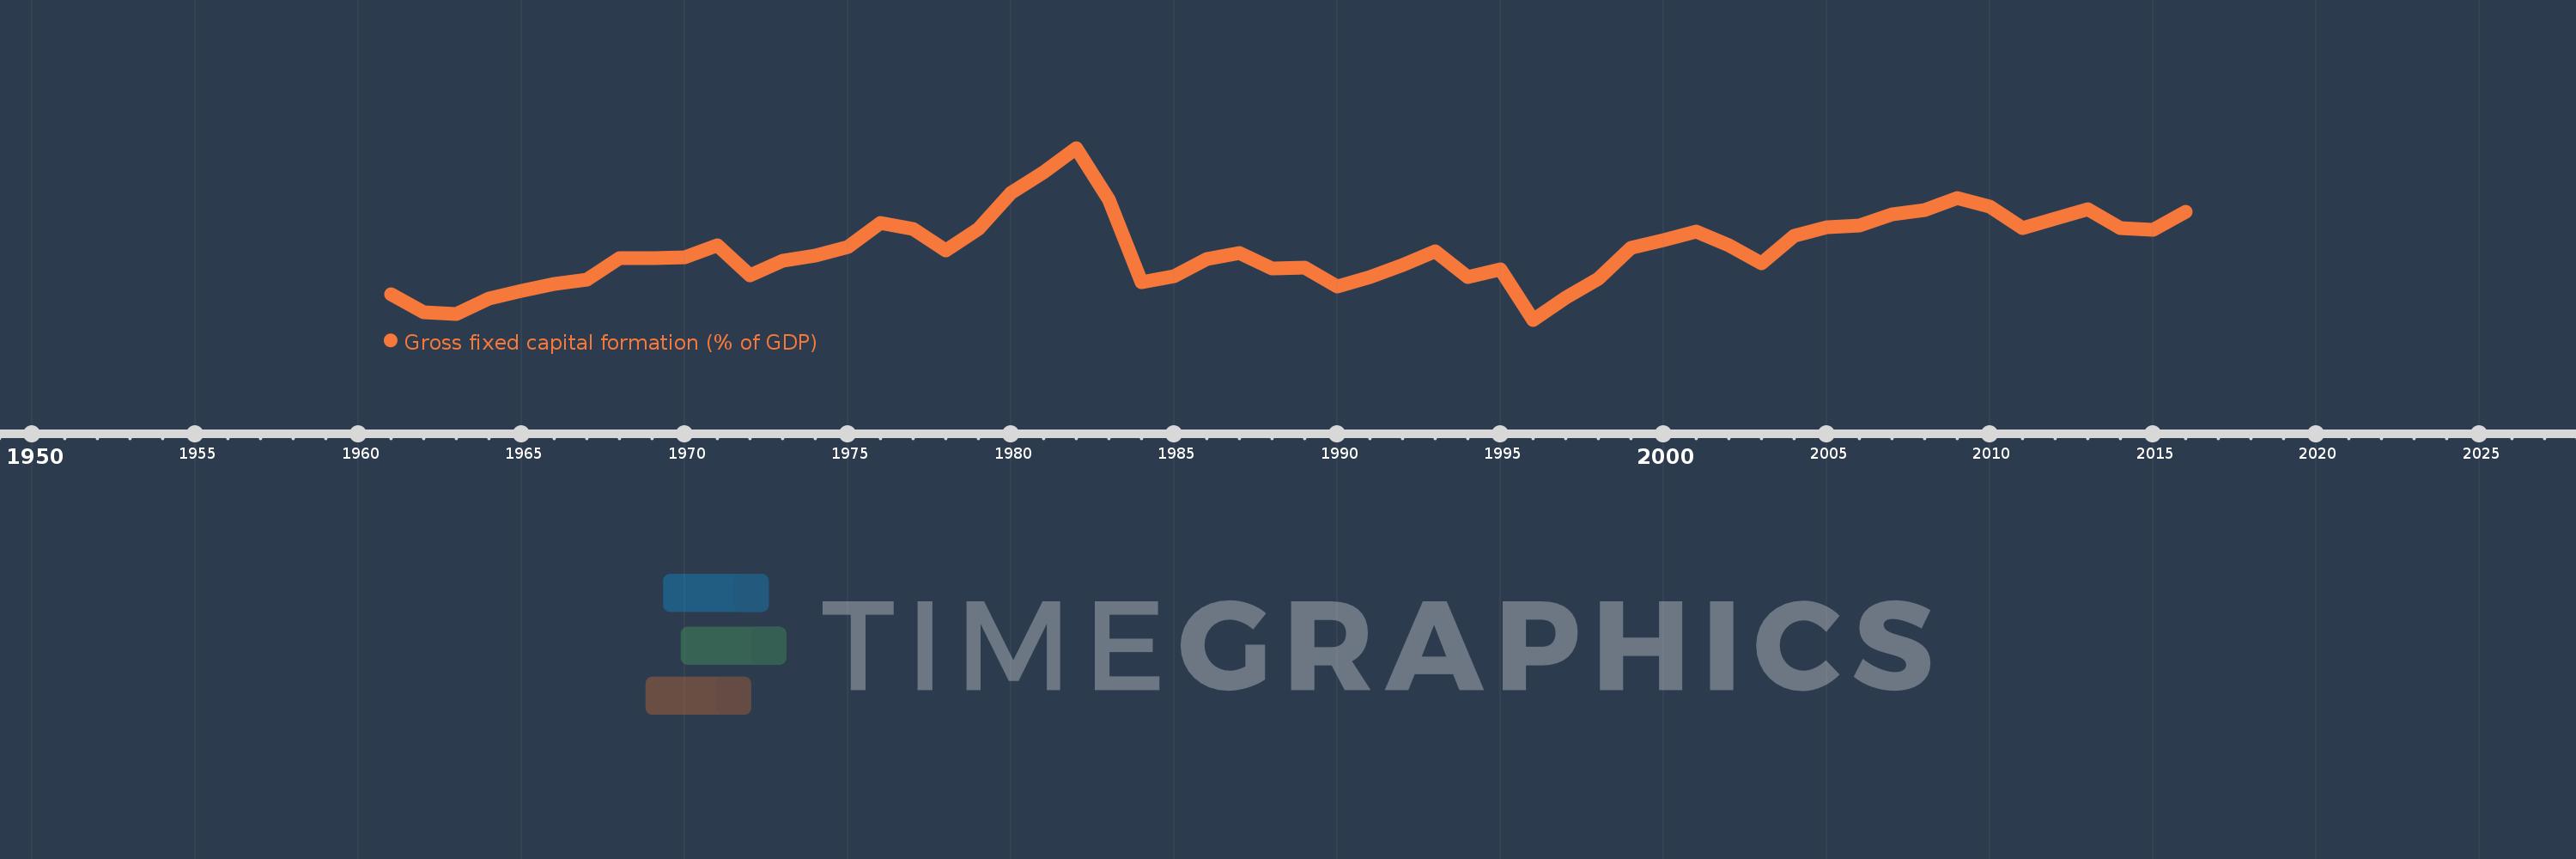
Gross fixed capital formation (% of GDP)
2016,2015,2014,2013,2012,2011,2010,2009,2008,2007,2006,2005,2004,2003,2002,2001,2000,1999,1998,1997,1996,1995,1994,1993,1992,1991,1990,1989,1988,1987,1986,1985,1984,1983,1982,1981,1980,1979,1978,1977,1976,1975,1974,1973,1972,1971,1970,1969,1968,1967,1966,1965,1964,1963,1962,1961
This statistics in other country:
AfghanistanAlbaniaAlgeriaAngolaAntigua and BarbudaArab WorldArgentinaArmeniaArubaAustraliaAustriaAzerbaijanBahamas, TheBahrainBangladeshBarbadosBelarusBelgiumBelizeBeninBermudaBhutanBoliviaBosnia and HerzegovinaBotswanaBrazilBrunei DarussalamBulgariaBurkina FasoBurundiCabo VerdeCambodiaCameroonCanadaCaribbean small statesCentral African RepublicCentral Europe and the BalticsChadChileChinaColombiaComorosCongo, Dem. Rep.Congo, Rep.Costa RicaCote d'IvoireCroatiaCubaCyprusCzech RepublicDenmarkDjiboutiDominicaDominican RepublicEarly-demographic dividendEast Asia & PacificEast Asia & Pacific (excluding high income)East Asia & Pacific (IDA & IBRD countries)EcuadorEgypt, Arab Rep.El SalvadorEquatorial GuineaEritreaEstoniaEthiopiaEuro areaEurope & Central AsiaEurope & Central Asia (excluding high income)Europe & Central Asia (IDA & IBRD countries)European UnionFijiFinlandFragile and conflict affected situationsFranceGabonGambia, TheGeorgiaGermanyGhanaGreeceGrenadaGuatemalaGuineaGuinea-BissauGuyanaHaitiHeavily indebted poor countries (HIPC)High incomeHondurasHong Kong SAR, ChinaHungaryIBRD onlyIcelandIDA & IBRD totalIDA blendIDA onlyIDA totalIndiaIndonesiaIran, Islamic Rep.IraqIrelandIsraelItalyJamaicaJapanJordanKazakhstanKenyaKiribatiKorea, Rep.KosovoKuwaitKyrgyz RepublicLao PDRLate-demographic dividendLatin America & Caribbean Latin America & Caribbean (excluding high income)Latin America & the Caribbean (IDA & IBRD countries)LatviaLeast developed countries: UN classificationLebanonLesothoLiberiaLibyaLithuaniaLow & middle incomeLow incomeLower middle incomeLuxembourgMacao SAR, ChinaMacedonia, FYRMadagascarMalawiMalaysiaMaldivesMaliMaltaMauritaniaMauritiusMexicoMicronesia, Fed. Sts.Middle East & North AfricaMiddle East & North Africa (excluding high income)Middle East & North Africa (IDA & IBRD countries)Middle incomeMoldovaMongoliaMontenegroMoroccoMozambiqueNamibiaNepalNetherlandsNew CaledoniaNew ZealandNicaraguaNigerNigeriaNorth AmericaNorwayOECD membersOmanPacific island small statesPakistanPanamaPapua New GuineaParaguayPeruPhilippinesPolandPortugalPost-demographic dividendPre-demographic dividendPuerto RicoRomaniaRussian FederationRwandaSaudi ArabiaSenegalSerbiaSeychellesSierra LeoneSingaporeSlovak RepublicSloveniaSolomon IslandsSomaliaSouth AfricaSouth AsiaSouth Asia (IDA & IBRD)South SudanSpainSri LankaSt. Kitts and NevisSt. LuciaSt. Vincent and the GrenadinesSub-Saharan Africa Sub-Saharan Africa (excluding high income)Sub-Saharan Africa (IDA & IBRD countries)SudanSurinameSwazilandSwedenSwitzerlandSyrian Arab RepublicTajikistanTanzaniaThailandTimor-LesteTogoTongaTrinidad and TobagoTunisiaTurkeyTurkmenistanUgandaUkraineUnited Arab EmiratesUnited KingdomUnited StatesUpper middle incomeUruguayUzbekistanVanuatuVenezuela, RBVietnamWest Bank and GazaWorldYemen, Rep.ZambiaZimbabwe Timeline:
This timeline shows a graph from 1961 to 2016 of Mexico. No data until 1960. Number of actual observations by date: 56.
Source name:
World Development Indicators
Source organization:
World Bank national accounts data, and OECD National Accounts data files.
Categories, topics:
Economy & Growth
Last updated:
apr 23, 2017
Indicators value changes by year
Minimum:
15.063
jan 1, 1996
Maximum:
26.388
jan 1, 1982
At the date of observation
Value
Absolute change
Change from previous value
jan 1, 1961
16.747
+16.747
0.0%
jan 1, 1962
15.54
-1.207
-7.21%
jan 1, 1963
15.446
-0.094
-0.6%
jan 1, 1964
16.486
+1.04
6.73%
jan 1, 1965
16.958
+0.473
2.87%
jan 1, 1966
17.396
+0.437
2.58%
jan 1, 1967
17.682
+0.286
1.64%
jan 1, 1968
19.109
+1.428
8.07%
jan 1, 1969
19.151
+0.041
0.22%
jan 1, 1970
19.166
+0.015
0.08%
jan 1, 1971
19.958
+0.792
4.13%
jan 1, 1972
17.974
-1.984
-9.94%
jan 1, 1973
18.97
+0.996
5.54%
jan 1, 1974
19.3
+0.33
1.74%
jan 1, 1975
19.881
+0.582
3.01%
jan 1, 1976
21.418
+1.536
7.73%
jan 1, 1977
21.038
-0.38
-1.78%
jan 1, 1978
19.647
-1.39
-6.61%
jan 1, 1979
21.067
+1.42
7.23%
jan 1, 1980
23.421
+2.354
11.17%
jan 1, 1981
24.759
+1.337
5.71%
jan 1, 1982
26.388
+1.63
6.58%
jan 1, 1983
22.952
-3.436
-13.02%
jan 1, 1984
17.546
-5.406
-23.56%
jan 1, 1985
17.94
+0.395
2.25%
jan 1, 1986
19.093
+1.152
6.42%
jan 1, 1987
19.465
+0.372
1.95%
jan 1, 1988
18.45
-1.015
-5.21%
jan 1, 1989
18.522
+0.072
0.39%
jan 1, 1990
17.248
-1.274
-6.88%
jan 1, 1991
17.88
+0.631
3.66%
jan 1, 1992
18.653
+0.773
4.32%
jan 1, 1993
19.598
+0.945
5.07%
jan 1, 1994
17.877
-1.722
-8.78%
jan 1, 1995
18.396
+0.519
2.9%
jan 1, 1996
15.063
-3.333
-18.12%
jan 1, 1997
16.52
+1.457
9.67%
jan 1, 1998
17.737
+1.217
7.37%
jan 1, 1999
19.797
+2.06
11.62%
jan 1, 2000
20.319
+0.522
2.63%
jan 1, 2001
20.902
+0.583
2.87%
jan 1, 2002
19.959
-0.942
-4.51%
jan 1, 2003
18.775
-1.184
-5.93%
jan 1, 2004
20.591
+1.815
9.67%
jan 1, 2005
21.154
+0.563
2.74%
jan 1, 2006
21.257
+0.103
0.49%
jan 1, 2007
22.011
+0.754
3.55%
jan 1, 2008
22.266
+0.256
1.16%
jan 1, 2009
23.093
+0.826
3.71%
jan 1, 2010
22.53
-0.563
-2.44%
jan 1, 2011
21.132
-1.398
-6.2%
jan 1, 2012
21.741
+0.609
2.88%
jan 1, 2013
22.328
+0.587
2.7%
jan 1, 2014
21.101
-1.227
-5.49%
jan 1, 2015
20.987
-0.114
-0.54%
jan 1, 2016
22.201
+1.214
5.79%
Ranking of countries by current statistics by years


Comments: