29
/
en
AIzaSyAYiBZKx7MnpbEhh9jyipgxe19OcubqV5w
April 1, 2024
215334
Oman
OMN
true
2
1
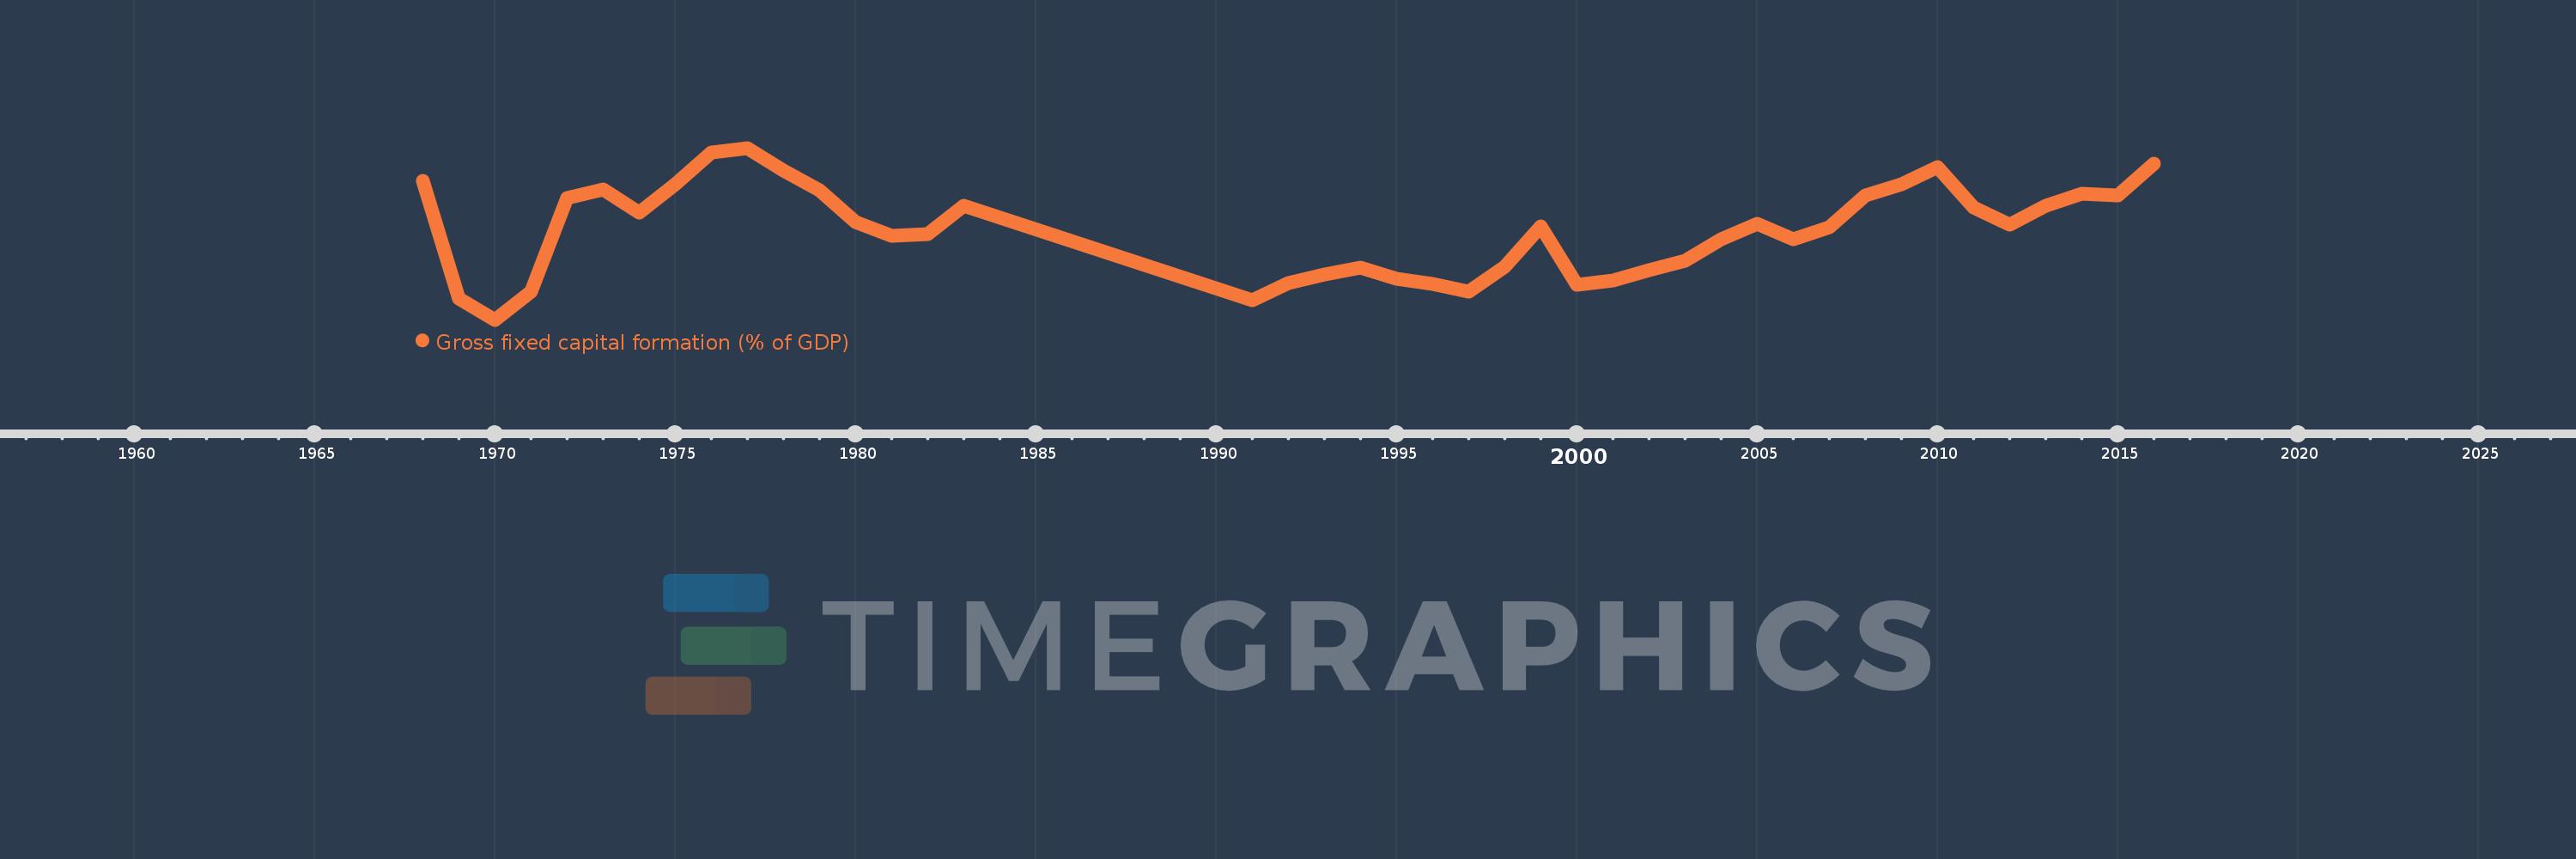
Gross fixed capital formation (% of GDP)
2016,2015,2014,2013,2012,2011,2010,2009,2008,2007,2006,2005,2004,2003,2002,2001,2000,1999,1998,1997,1996,1995,1994,1993,1992,1991,1983,1982,1981,1980,1979,1978,1977,1976,1975,1974,1973,1972,1971,1970,1969,1968
This statistics in other country:
AfghanistanAlbaniaAlgeriaAngolaAntigua and BarbudaArab WorldArgentinaArmeniaArubaAustraliaAustriaAzerbaijanBahamas, TheBahrainBangladeshBarbadosBelarusBelgiumBelizeBeninBermudaBhutanBoliviaBosnia and HerzegovinaBotswanaBrazilBrunei DarussalamBulgariaBurkina FasoBurundiCabo VerdeCambodiaCameroonCanadaCaribbean small statesCentral African RepublicCentral Europe and the BalticsChadChileChinaColombiaComorosCongo, Dem. Rep.Congo, Rep.Costa RicaCote d'IvoireCroatiaCubaCyprusCzech RepublicDenmarkDjiboutiDominicaDominican RepublicEarly-demographic dividendEast Asia & PacificEast Asia & Pacific (excluding high income)East Asia & Pacific (IDA & IBRD countries)EcuadorEgypt, Arab Rep.El SalvadorEquatorial GuineaEritreaEstoniaEthiopiaEuro areaEurope & Central AsiaEurope & Central Asia (excluding high income)Europe & Central Asia (IDA & IBRD countries)European UnionFijiFinlandFragile and conflict affected situationsFranceGabonGambia, TheGeorgiaGermanyGhanaGreeceGrenadaGuatemalaGuineaGuinea-BissauGuyanaHaitiHeavily indebted poor countries (HIPC)High incomeHondurasHong Kong SAR, ChinaHungaryIBRD onlyIcelandIDA & IBRD totalIDA blendIDA onlyIDA totalIndiaIndonesiaIran, Islamic Rep.IraqIrelandIsraelItalyJamaicaJapanJordanKazakhstanKenyaKiribatiKorea, Rep.KosovoKuwaitKyrgyz RepublicLao PDRLate-demographic dividendLatin America & Caribbean Latin America & Caribbean (excluding high income)Latin America & the Caribbean (IDA & IBRD countries)LatviaLeast developed countries: UN classificationLebanonLesothoLiberiaLibyaLithuaniaLow & middle incomeLow incomeLower middle incomeLuxembourgMacao SAR, ChinaMacedonia, FYRMadagascarMalawiMalaysiaMaldivesMaliMaltaMauritaniaMauritiusMexicoMicronesia, Fed. Sts.Middle East & North AfricaMiddle East & North Africa (excluding high income)Middle East & North Africa (IDA & IBRD countries)Middle incomeMoldovaMongoliaMontenegroMoroccoMozambiqueNamibiaNepalNetherlandsNew CaledoniaNew ZealandNicaraguaNigerNigeriaNorth AmericaNorwayOECD membersOmanPacific island small statesPakistanPanamaPapua New GuineaParaguayPeruPhilippinesPolandPortugalPost-demographic dividendPre-demographic dividendPuerto RicoRomaniaRussian FederationRwandaSaudi ArabiaSenegalSerbiaSeychellesSierra LeoneSingaporeSlovak RepublicSloveniaSolomon IslandsSomaliaSouth AfricaSouth AsiaSouth Asia (IDA & IBRD)South SudanSpainSri LankaSt. Kitts and NevisSt. LuciaSt. Vincent and the GrenadinesSub-Saharan Africa Sub-Saharan Africa (excluding high income)Sub-Saharan Africa (IDA & IBRD countries)SudanSurinameSwazilandSwedenSwitzerlandSyrian Arab RepublicTajikistanTanzaniaThailandTimor-LesteTogoTongaTrinidad and TobagoTunisiaTurkeyTurkmenistanUgandaUkraineUnited Arab EmiratesUnited KingdomUnited StatesUpper middle incomeUruguayUzbekistanVanuatuVenezuela, RBVietnamWest Bank and GazaWorldYemen, Rep.ZambiaZimbabwe Timeline:
This timeline shows a graph from 1968 to 2016 of Oman. No data until 1967. Number of actual observations by date: 42.
Source name:
World Development Indicators
Source organization:
World Bank national accounts data, and OECD National Accounts data files.
Categories, topics:
Economy & Growth
Last updated:
apr 23, 2017
Indicators value changes by year
Maximum:
36.323
jan 1, 1977
At the date of observation
Value
Absolute change
Change from previous value
jan 1, 1968
31.186
+31.186
0.0%
jan 1, 1969
12.579
-18.606
-59.66%
jan 1, 1970
9.3
-3.279
-26.07%
jan 1, 1971
13.764
+4.464
48.0%
jan 1, 1972
28.457
+14.693
106.75%
jan 1, 1973
29.83
+1.372
4.82%
jan 1, 1974
26.21
-3.619
-12.13%
jan 1, 1975
30.624
+4.414
16.84%
jan 1, 1976
35.626
+5.001
16.33%
jan 1, 1977
36.323
+0.697
1.96%
jan 1, 1978
32.826
-3.496
-9.63%
jan 1, 1979
29.688
-3.138
-9.56%
jan 1, 1980
24.661
-5.028
-16.93%
jan 1, 1981
22.472
-2.188
-8.87%
jan 1, 1982
22.73
+0.257
1.15%
jan 1, 1983
27.179
+4.449
19.57%
jan 1, 1991
12.348
-14.83
-54.57%
jan 1, 1992
15.02
+2.672
21.64%
jan 1, 1993
16.354
+1.334
8.88%
jan 1, 1994
17.535
+1.181
7.22%
jan 1, 1995
15.743
-1.792
-10.22%
jan 1, 1996
14.98
-0.763
-4.85%
jan 1, 1997
13.695
-1.285
-8.58%
jan 1, 1998
17.645
+3.95
28.84%
jan 1, 1999
23.98
+6.335
35.9%
jan 1, 2000
14.85
-9.13
-38.07%
jan 1, 2001
15.451
+0.6
4.04%
jan 1, 2002
17.058
+1.607
10.4%
jan 1, 2003
18.645
+1.587
9.3%
jan 1, 2004
21.917
+3.272
17.55%
jan 1, 2005
24.37
+2.453
11.19%
jan 1, 2006
22.016
-2.354
-9.66%
jan 1, 2007
23.869
+1.854
8.42%
jan 1, 2008
28.869
+5.0
20.95%
jan 1, 2009
30.629
+1.76
6.1%
jan 1, 2010
33.306
+2.677
8.74%
jan 1, 2011
27.017
-6.289
-18.88%
jan 1, 2012
24.236
-2.781
-10.29%
jan 1, 2013
27.198
+2.963
12.23%
jan 1, 2014
29.145
+1.946
7.16%
jan 1, 2015
28.798
-0.346
-1.19%
jan 1, 2016
33.821
+5.023
17.44%
Ranking of countries by current statistics by years


Comments: