29
/
en
AIzaSyAYiBZKx7MnpbEhh9jyipgxe19OcubqV5w
April 1, 2024
277732
Uruguay
URY
true
2
1
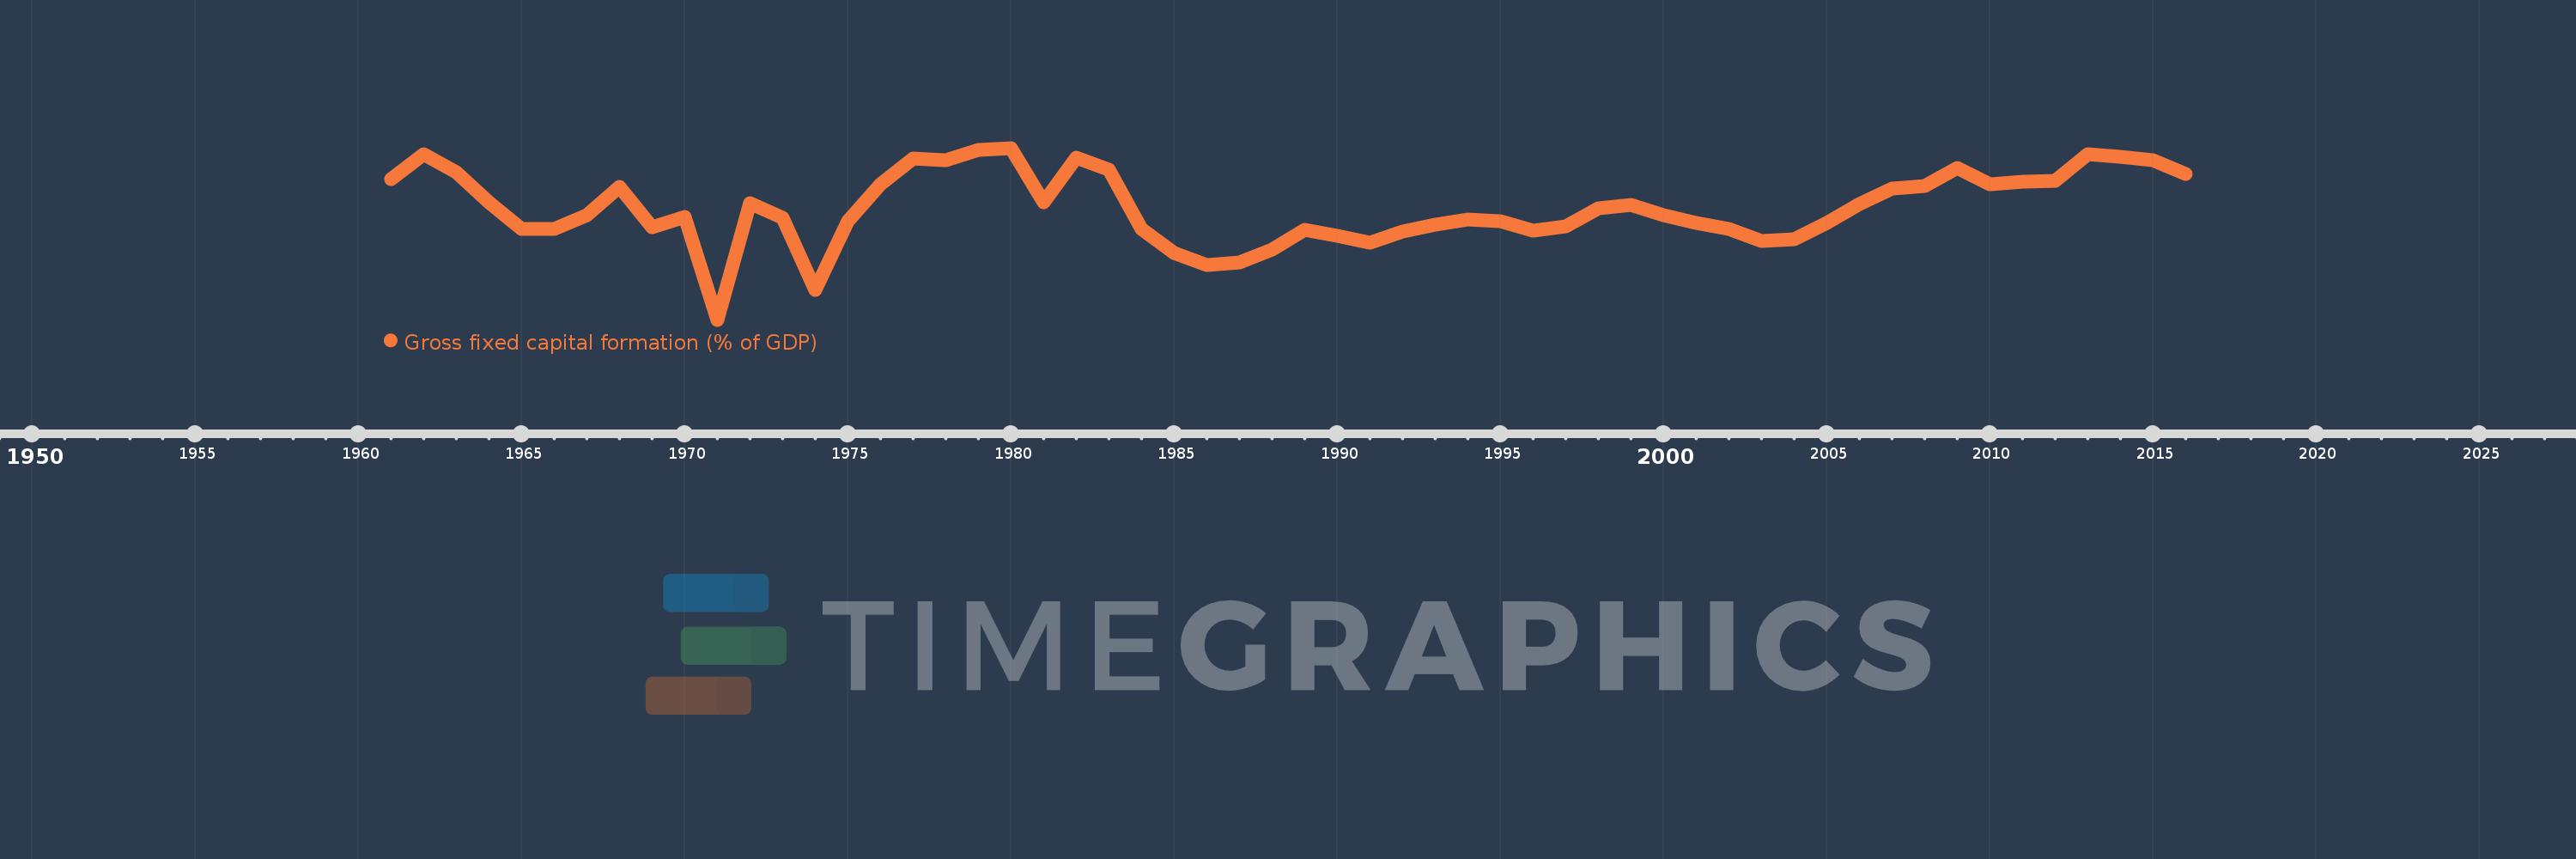
Gross fixed capital formation (% of GDP)
2016,2015,2014,2013,2012,2011,2010,2009,2008,2007,2006,2005,2004,2003,2002,2001,2000,1999,1998,1997,1996,1995,1994,1993,1992,1991,1990,1989,1988,1987,1986,1985,1984,1983,1982,1981,1980,1979,1978,1977,1976,1975,1974,1973,1972,1971,1970,1969,1968,1967,1966,1965,1964,1963,1962,1961
This statistics in other country:
AfghanistanAlbaniaAlgeriaAngolaAntigua and BarbudaArab WorldArgentinaArmeniaArubaAustraliaAustriaAzerbaijanBahamas, TheBahrainBangladeshBarbadosBelarusBelgiumBelizeBeninBermudaBhutanBoliviaBosnia and HerzegovinaBotswanaBrazilBrunei DarussalamBulgariaBurkina FasoBurundiCabo VerdeCambodiaCameroonCanadaCaribbean small statesCentral African RepublicCentral Europe and the BalticsChadChileChinaColombiaComorosCongo, Dem. Rep.Congo, Rep.Costa RicaCote d'IvoireCroatiaCubaCyprusCzech RepublicDenmarkDjiboutiDominicaDominican RepublicEarly-demographic dividendEast Asia & PacificEast Asia & Pacific (excluding high income)East Asia & Pacific (IDA & IBRD countries)EcuadorEgypt, Arab Rep.El SalvadorEquatorial GuineaEritreaEstoniaEthiopiaEuro areaEurope & Central AsiaEurope & Central Asia (excluding high income)Europe & Central Asia (IDA & IBRD countries)European UnionFijiFinlandFragile and conflict affected situationsFranceGabonGambia, TheGeorgiaGermanyGhanaGreeceGrenadaGuatemalaGuineaGuinea-BissauGuyanaHaitiHeavily indebted poor countries (HIPC)High incomeHondurasHong Kong SAR, ChinaHungaryIBRD onlyIcelandIDA & IBRD totalIDA blendIDA onlyIDA totalIndiaIndonesiaIran, Islamic Rep.IraqIrelandIsraelItalyJamaicaJapanJordanKazakhstanKenyaKiribatiKorea, Rep.KosovoKuwaitKyrgyz RepublicLao PDRLate-demographic dividendLatin America & Caribbean Latin America & Caribbean (excluding high income)Latin America & the Caribbean (IDA & IBRD countries)LatviaLeast developed countries: UN classificationLebanonLesothoLiberiaLibyaLithuaniaLow & middle incomeLow incomeLower middle incomeLuxembourgMacao SAR, ChinaMacedonia, FYRMadagascarMalawiMalaysiaMaldivesMaliMaltaMauritaniaMauritiusMexicoMicronesia, Fed. Sts.Middle East & North AfricaMiddle East & North Africa (excluding high income)Middle East & North Africa (IDA & IBRD countries)Middle incomeMoldovaMongoliaMontenegroMoroccoMozambiqueNamibiaNepalNetherlandsNew CaledoniaNew ZealandNicaraguaNigerNigeriaNorth AmericaNorwayOECD membersOmanPacific island small statesPakistanPanamaPapua New GuineaParaguayPeruPhilippinesPolandPortugalPost-demographic dividendPre-demographic dividendPuerto RicoRomaniaRussian FederationRwandaSaudi ArabiaSenegalSerbiaSeychellesSierra LeoneSingaporeSlovak RepublicSloveniaSolomon IslandsSomaliaSouth AfricaSouth AsiaSouth Asia (IDA & IBRD)South SudanSpainSri LankaSt. Kitts and NevisSt. LuciaSt. Vincent and the GrenadinesSub-Saharan Africa Sub-Saharan Africa (excluding high income)Sub-Saharan Africa (IDA & IBRD countries)SudanSurinameSwazilandSwedenSwitzerlandSyrian Arab RepublicTajikistanTanzaniaThailandTimor-LesteTogoTongaTrinidad and TobagoTunisiaTurkeyTurkmenistanUgandaUkraineUnited Arab EmiratesUnited KingdomUnited StatesUpper middle incomeUruguayUzbekistanVanuatuVenezuela, RBVietnamWest Bank and GazaWorldYemen, Rep.ZambiaZimbabwe Timeline:
This timeline shows a graph from 1961 to 2016 of Uruguay. No data until 1960. Number of actual observations by date: 56.
Source name:
World Development Indicators
Source organization:
World Bank national accounts data, and OECD National Accounts data files.
Categories, topics:
Economy & Growth
Last updated:
apr 23, 2017
Indicators value changes by year
Maximum:
22.864
jan 1, 1980
At the date of observation
Value
Absolute change
Change from previous value
jan 1, 1961
19.31
+19.31
0.0%
jan 1, 1962
22.159
+2.849
14.75%
jan 1, 1963
20.103
-2.056
-9.28%
jan 1, 1964
16.738
-3.365
-16.74%
jan 1, 1965
13.731
-3.007
-17.96%
jan 1, 1966
13.661
-0.07
-0.51%
jan 1, 1967
15.282
+1.621
11.86%
jan 1, 1968
18.426
+3.144
20.57%
jan 1, 1969
13.911
-4.515
-24.5%
jan 1, 1970
15.088
+1.177
8.46%
jan 1, 1971
3.396
-11.691
-77.49%
jan 1, 1972
16.59
+13.194
388.49%
jan 1, 1973
14.92
-1.67
-10.07%
jan 1, 1974
6.739
-8.181
-54.83%
jan 1, 1975
14.518
+7.779
115.42%
jan 1, 1976
18.746
+4.228
29.12%
jan 1, 1977
21.628
+2.882
15.37%
jan 1, 1978
21.496
-0.132
-0.61%
jan 1, 1979
22.683
+1.187
5.52%
jan 1, 1980
22.864
+0.18
0.8%
jan 1, 1981
16.726
-6.138
-26.84%
jan 1, 1982
21.728
+5.002
29.91%
jan 1, 1983
20.426
-1.303
-6.0%
jan 1, 1984
13.683
-6.742
-33.01%
jan 1, 1985
10.956
-2.728
-19.94%
jan 1, 1986
9.631
-1.325
-12.09%
jan 1, 1987
9.894
+0.263
2.73%
jan 1, 1988
11.393
+1.499
15.15%
jan 1, 1989
13.582
+2.189
19.21%
jan 1, 1990
12.953
-0.629
-4.63%
jan 1, 1991
12.139
-0.814
-6.28%
jan 1, 1992
13.436
+1.297
10.68%
jan 1, 1993
14.2
+0.764
5.68%
jan 1, 1994
14.754
+0.554
3.9%
jan 1, 1995
14.545
-0.209
-1.42%
jan 1, 1996
13.527
-1.018
-7.0%
jan 1, 1997
13.963
+0.436
3.22%
jan 1, 1998
16.034
+2.071
14.83%
jan 1, 1999
16.383
+0.349
2.18%
jan 1, 2000
15.238
-1.145
-6.99%
jan 1, 2001
14.319
-0.919
-6.03%
jan 1, 2002
13.657
-0.662
-4.62%
jan 1, 2003
12.353
-1.303
-9.54%
jan 1, 2004
12.521
+0.167
1.36%
jan 1, 2005
14.367
+1.847
14.75%
jan 1, 2006
16.547
+2.18
15.17%
jan 1, 2007
18.237
+1.69
10.21%
jan 1, 2008
18.578
+0.341
1.87%
jan 1, 2009
20.553
+1.976
10.63%
jan 1, 2010
18.745
-1.809
-8.8%
jan 1, 2011
19.07
+0.325
1.74%
jan 1, 2012
19.119
+0.048
0.25%
jan 1, 2013
22.153
+3.035
15.87%
jan 1, 2014
21.843
-0.311
-1.4%
jan 1, 2015
21.438
-0.404
-1.85%
jan 1, 2016
19.94
-1.498
-6.99%
Ranking of countries by current statistics by years


Comments: