29
/
en
AIzaSyAYiBZKx7MnpbEhh9jyipgxe19OcubqV5w
April 1, 2024
36613
IBRD only
IBD
false
2
1
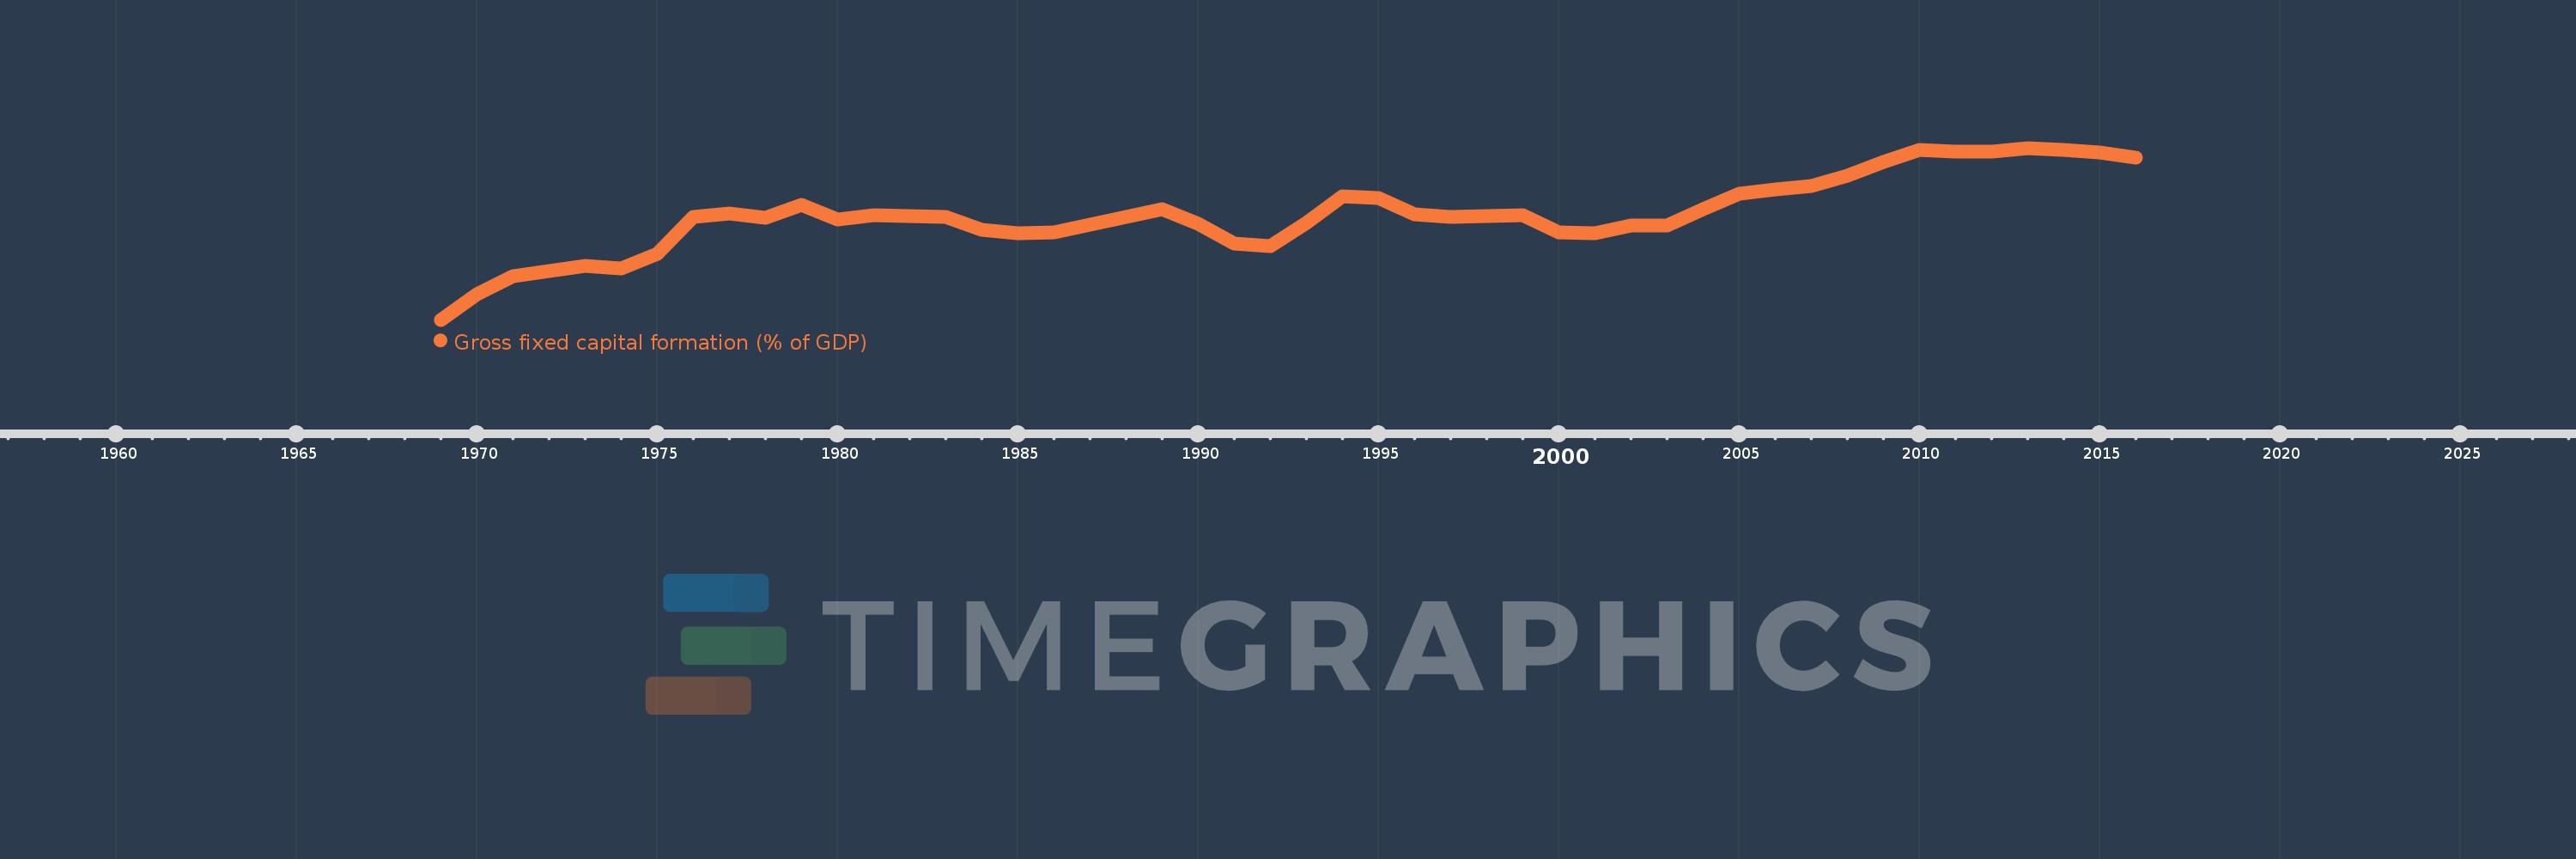
Gross fixed capital formation (% of GDP)
2016,2015,2014,2013,2012,2011,2010,2009,2008,2007,2006,2005,2004,2003,2002,2001,2000,1999,1998,1997,1996,1995,1994,1993,1992,1991,1990,1989,1988,1987,1986,1985,1984,1983,1982,1981,1980,1979,1978,1977,1976,1975,1974,1973,1972,1971,1970,1969
This statistics in other country:
AfghanistanAlbaniaAlgeriaAngolaAntigua and BarbudaArab WorldArgentinaArmeniaArubaAustraliaAustriaAzerbaijanBahamas, TheBahrainBangladeshBarbadosBelarusBelgiumBelizeBeninBermudaBhutanBoliviaBosnia and HerzegovinaBotswanaBrazilBrunei DarussalamBulgariaBurkina FasoBurundiCabo VerdeCambodiaCameroonCanadaCaribbean small statesCentral African RepublicCentral Europe and the BalticsChadChileChinaColombiaComorosCongo, Dem. Rep.Congo, Rep.Costa RicaCote d'IvoireCroatiaCubaCyprusCzech RepublicDenmarkDjiboutiDominicaDominican RepublicEarly-demographic dividendEast Asia & PacificEast Asia & Pacific (excluding high income)East Asia & Pacific (IDA & IBRD countries)EcuadorEgypt, Arab Rep.El SalvadorEquatorial GuineaEritreaEstoniaEthiopiaEuro areaEurope & Central AsiaEurope & Central Asia (excluding high income)Europe & Central Asia (IDA & IBRD countries)European UnionFijiFinlandFragile and conflict affected situationsFranceGabonGambia, TheGeorgiaGermanyGhanaGreeceGrenadaGuatemalaGuineaGuinea-BissauGuyanaHaitiHeavily indebted poor countries (HIPC)High incomeHondurasHong Kong SAR, ChinaHungaryIBRD onlyIcelandIDA & IBRD totalIDA blendIDA onlyIDA totalIndiaIndonesiaIran, Islamic Rep.IraqIrelandIsraelItalyJamaicaJapanJordanKazakhstanKenyaKiribatiKorea, Rep.KosovoKuwaitKyrgyz RepublicLao PDRLate-demographic dividendLatin America & Caribbean Latin America & Caribbean (excluding high income)Latin America & the Caribbean (IDA & IBRD countries)LatviaLeast developed countries: UN classificationLebanonLesothoLiberiaLibyaLithuaniaLow & middle incomeLow incomeLower middle incomeLuxembourgMacao SAR, ChinaMacedonia, FYRMadagascarMalawiMalaysiaMaldivesMaliMaltaMauritaniaMauritiusMexicoMicronesia, Fed. Sts.Middle East & North AfricaMiddle East & North Africa (excluding high income)Middle East & North Africa (IDA & IBRD countries)Middle incomeMoldovaMongoliaMontenegroMoroccoMozambiqueNamibiaNepalNetherlandsNew CaledoniaNew ZealandNicaraguaNigerNigeriaNorth AmericaNorwayOECD membersOmanPacific island small statesPakistanPanamaPapua New GuineaParaguayPeruPhilippinesPolandPortugalPost-demographic dividendPre-demographic dividendPuerto RicoRomaniaRussian FederationRwandaSaudi ArabiaSenegalSerbiaSeychellesSierra LeoneSingaporeSlovak RepublicSloveniaSolomon IslandsSomaliaSouth AfricaSouth AsiaSouth Asia (IDA & IBRD)South SudanSpainSri LankaSt. Kitts and NevisSt. LuciaSt. Vincent and the GrenadinesSub-Saharan Africa Sub-Saharan Africa (excluding high income)Sub-Saharan Africa (IDA & IBRD countries)SudanSurinameSwazilandSwedenSwitzerlandSyrian Arab RepublicTajikistanTanzaniaThailandTimor-LesteTogoTongaTrinidad and TobagoTunisiaTurkeyTurkmenistanUgandaUkraineUnited Arab EmiratesUnited KingdomUnited StatesUpper middle incomeUruguayUzbekistanVanuatuVenezuela, RBVietnamWest Bank and GazaWorldYemen, Rep.ZambiaZimbabwe Timeline:
This timeline shows a graph from 1969 to 2016 of IBRD only. No data until 1968. Number of actual observations by date: 48.
Source name:
World Development Indicators
Source organization:
World Bank national accounts data, and OECD National Accounts data files.
Categories, topics:
Economy & Growth
Last updated:
apr 23, 2017
Indicators value changes by year
Maximum:
30.479
jan 1, 2013
At the date of observation
Value
Absolute change
Change from previous value
jan 1, 1969
17.84
+17.84
0.0%
jan 1, 1970
19.723
+1.883
10.56%
jan 1, 1971
21.063
+1.34
6.79%
jan 1, 1972
21.419
+0.356
1.69%
jan 1, 1973
21.778
+0.359
1.67%
jan 1, 1974
21.59
-0.188
-0.86%
jan 1, 1975
22.677
+1.087
5.03%
jan 1, 1976
25.423
+2.746
12.11%
jan 1, 1977
25.67
+0.247
0.97%
jan 1, 1978
25.33
-0.34
-1.32%
jan 1, 1979
26.276
+0.946
3.73%
jan 1, 1980
25.22
-1.056
-4.02%
jan 1, 1981
25.53
+0.31
1.23%
jan 1, 1982
25.457
-0.073
-0.28%
jan 1, 1983
25.383
-0.075
-0.29%
jan 1, 1984
24.428
-0.955
-3.76%
jan 1, 1985
24.207
-0.221
-0.9%
jan 1, 1986
24.266
+0.059
0.24%
jan 1, 1987
24.842
+0.576
2.37%
jan 1, 1988
25.383
+0.541
2.18%
jan 1, 1989
25.944
+0.561
2.21%
jan 1, 1990
24.923
-1.021
-3.94%
jan 1, 1991
23.43
-1.493
-5.99%
jan 1, 1992
23.225
-0.204
-0.87%
jan 1, 1993
24.959
+1.734
7.47%
jan 1, 1994
26.949
+1.989
7.97%
jan 1, 1995
26.789
-0.16
-0.59%
jan 1, 1996
25.588
-1.201
-4.48%
jan 1, 1997
25.433
-0.155
-0.61%
jan 1, 1998
25.454
+0.021
0.08%
jan 1, 1999
25.533
+0.079
0.31%
jan 1, 2000
24.242
-1.291
-5.06%
jan 1, 2001
24.212
-0.031
-0.13%
jan 1, 2002
24.752
+0.541
2.23%
jan 1, 2003
24.764
+0.012
0.05%
jan 1, 2004
25.948
+1.184
4.78%
jan 1, 2005
27.116
+1.168
4.5%
jan 1, 2006
27.445
+0.329
1.21%
jan 1, 2007
27.71
+0.265
0.96%
jan 1, 2008
28.427
+0.717
2.59%
jan 1, 2009
29.418
+0.991
3.48%
jan 1, 2010
30.322
+0.905
3.08%
jan 1, 2011
30.186
-0.137
-0.45%
jan 1, 2012
30.178
-0.007
-0.02%
jan 1, 2013
30.479
+0.301
1.0%
jan 1, 2014
30.355
-0.124
-0.41%
jan 1, 2015
30.113
-0.242
-0.8%
jan 1, 2016
29.779
-0.333
-1.11%
Ranking of countries by current statistics by years


Comments: