29
/
en
AIzaSyAYiBZKx7MnpbEhh9jyipgxe19OcubqV5w
April 1, 2024
272300
Uganda
UGA
true
2
1
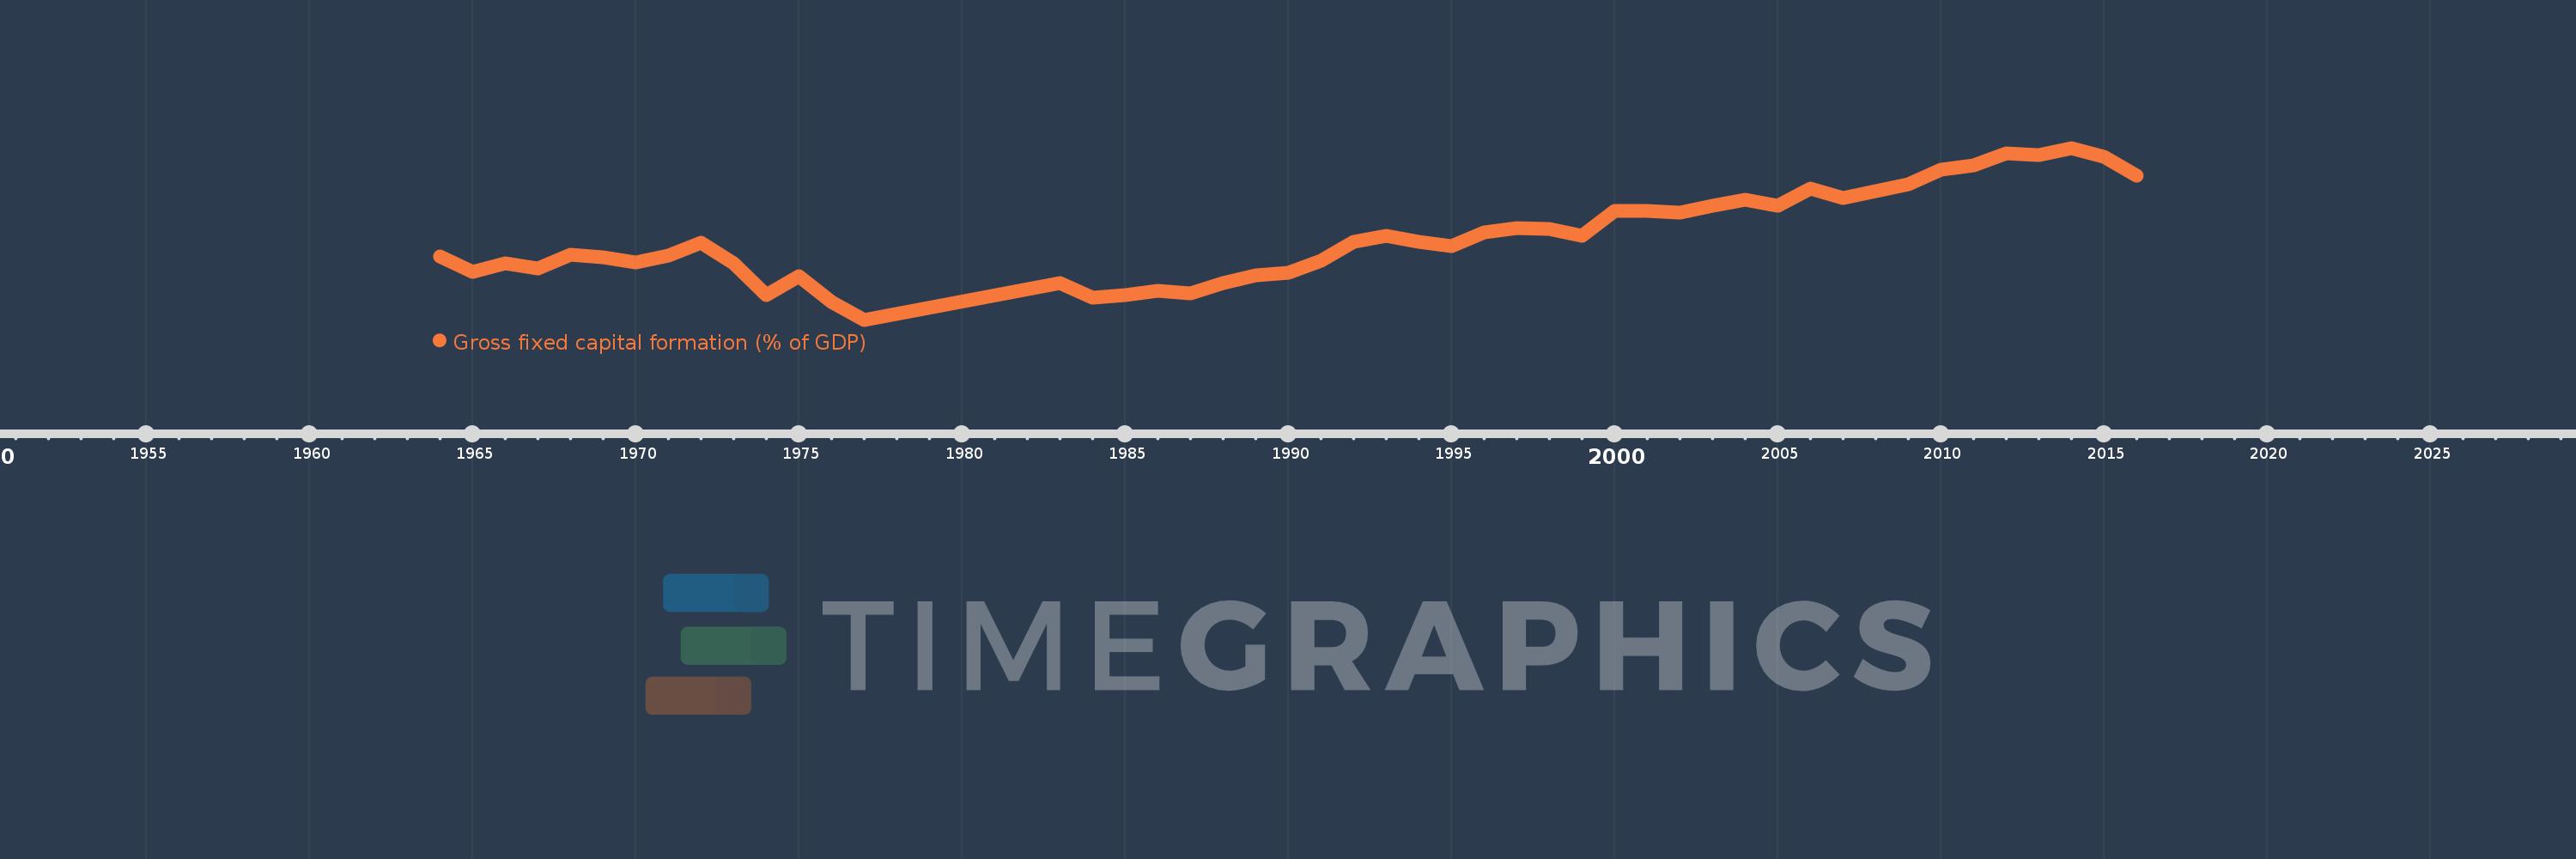
Gross fixed capital formation (% of GDP)
2016,2015,2014,2013,2012,2011,2010,2009,2008,2007,2006,2005,2004,2003,2002,2001,2000,1999,1998,1997,1996,1995,1994,1993,1992,1991,1990,1989,1988,1987,1986,1985,1984,1983,1977,1976,1975,1974,1973,1972,1971,1970,1969,1968,1967,1966,1965,1964
This statistics in other country:
AfghanistanAlbaniaAlgeriaAngolaAntigua and BarbudaArab WorldArgentinaArmeniaArubaAustraliaAustriaAzerbaijanBahamas, TheBahrainBangladeshBarbadosBelarusBelgiumBelizeBeninBermudaBhutanBoliviaBosnia and HerzegovinaBotswanaBrazilBrunei DarussalamBulgariaBurkina FasoBurundiCabo VerdeCambodiaCameroonCanadaCaribbean small statesCentral African RepublicCentral Europe and the BalticsChadChileChinaColombiaComorosCongo, Dem. Rep.Congo, Rep.Costa RicaCote d'IvoireCroatiaCubaCyprusCzech RepublicDenmarkDjiboutiDominicaDominican RepublicEarly-demographic dividendEast Asia & PacificEast Asia & Pacific (excluding high income)East Asia & Pacific (IDA & IBRD countries)EcuadorEgypt, Arab Rep.El SalvadorEquatorial GuineaEritreaEstoniaEthiopiaEuro areaEurope & Central AsiaEurope & Central Asia (excluding high income)Europe & Central Asia (IDA & IBRD countries)European UnionFijiFinlandFragile and conflict affected situationsFranceGabonGambia, TheGeorgiaGermanyGhanaGreeceGrenadaGuatemalaGuineaGuinea-BissauGuyanaHaitiHeavily indebted poor countries (HIPC)High incomeHondurasHong Kong SAR, ChinaHungaryIBRD onlyIcelandIDA & IBRD totalIDA blendIDA onlyIDA totalIndiaIndonesiaIran, Islamic Rep.IraqIrelandIsraelItalyJamaicaJapanJordanKazakhstanKenyaKiribatiKorea, Rep.KosovoKuwaitKyrgyz RepublicLao PDRLate-demographic dividendLatin America & Caribbean Latin America & Caribbean (excluding high income)Latin America & the Caribbean (IDA & IBRD countries)LatviaLeast developed countries: UN classificationLebanonLesothoLiberiaLibyaLithuaniaLow & middle incomeLow incomeLower middle incomeLuxembourgMacao SAR, ChinaMacedonia, FYRMadagascarMalawiMalaysiaMaldivesMaliMaltaMauritaniaMauritiusMexicoMicronesia, Fed. Sts.Middle East & North AfricaMiddle East & North Africa (excluding high income)Middle East & North Africa (IDA & IBRD countries)Middle incomeMoldovaMongoliaMontenegroMoroccoMozambiqueNamibiaNepalNetherlandsNew CaledoniaNew ZealandNicaraguaNigerNigeriaNorth AmericaNorwayOECD membersOmanPacific island small statesPakistanPanamaPapua New GuineaParaguayPeruPhilippinesPolandPortugalPost-demographic dividendPre-demographic dividendPuerto RicoRomaniaRussian FederationRwandaSaudi ArabiaSenegalSerbiaSeychellesSierra LeoneSingaporeSlovak RepublicSloveniaSolomon IslandsSomaliaSouth AfricaSouth AsiaSouth Asia (IDA & IBRD)South SudanSpainSri LankaSt. Kitts and NevisSt. LuciaSt. Vincent and the GrenadinesSub-Saharan Africa Sub-Saharan Africa (excluding high income)Sub-Saharan Africa (IDA & IBRD countries)SudanSurinameSwazilandSwedenSwitzerlandSyrian Arab RepublicTajikistanTanzaniaThailandTimor-LesteTogoTongaTrinidad and TobagoTunisiaTurkeyTurkmenistanUgandaUkraineUnited Arab EmiratesUnited KingdomUnited StatesUpper middle incomeUruguayUzbekistanVanuatuVenezuela, RBVietnamWest Bank and GazaWorldYemen, Rep.ZambiaZimbabwe Timeline:
This timeline shows a graph from 1964 to 2016 of Uganda. No data until 1963. Number of actual observations by date: 48.
Source name:
World Development Indicators
Source organization:
World Bank national accounts data, and OECD National Accounts data files.
Categories, topics:
Economy & Growth
Last updated:
apr 23, 2017
Indicators value changes by year
At the date of observation
Value
Absolute change
Change from previous value
jan 1, 1964
13.204
+13.204
0.0%
jan 1, 1965
11.187
-2.017
-15.27%
jan 1, 1966
12.346
+1.159
10.36%
jan 1, 1967
11.649
-0.697
-5.64%
jan 1, 1968
13.461
+1.812
15.55%
jan 1, 1969
13.09
-0.37
-2.75%
jan 1, 1970
12.46
-0.631
-4.82%
jan 1, 1971
13.338
+0.878
7.05%
jan 1, 1972
15.114
+1.776
13.32%
jan 1, 1973
12.394
-2.72
-17.99%
jan 1, 1974
8.226
-4.168
-33.63%
jan 1, 1975
10.664
+2.438
29.64%
jan 1, 1976
7.252
-3.412
-32.0%
jan 1, 1977
4.944
-2.308
-31.82%
jan 1, 1983
9.736
+4.792
96.92%
jan 1, 1984
7.856
-1.88
-19.31%
jan 1, 1985
8.235
+0.379
4.83%
jan 1, 1986
8.732
+0.497
6.03%
jan 1, 1987
8.447
-0.285
-3.26%
jan 1, 1988
9.718
+1.271
15.05%
jan 1, 1989
10.792
+1.074
11.05%
jan 1, 1990
11.136
+0.344
3.19%
jan 1, 1991
12.704
+1.568
14.08%
jan 1, 1992
15.171
+2.467
19.42%
jan 1, 1993
15.916
+0.745
4.91%
jan 1, 1994
15.215
-0.701
-4.41%
jan 1, 1995
14.634
-0.581
-3.82%
jan 1, 1996
16.367
+1.733
11.84%
jan 1, 1997
16.973
+0.605
3.7%
jan 1, 1998
16.894
-0.079
-0.46%
jan 1, 1999
15.924
-0.97
-5.74%
jan 1, 2000
19.265
+3.341
20.98%
jan 1, 2001
19.234
-0.031
-0.16%
jan 1, 2002
19.048
-0.186
-0.97%
jan 1, 2003
19.963
+0.916
4.81%
jan 1, 2004
20.683
+0.72
3.61%
jan 1, 2005
19.944
-0.739
-3.57%
jan 1, 2006
22.202
+2.257
11.32%
jan 1, 2007
20.925
-1.277
-5.75%
jan 1, 2008
21.869
+0.944
4.51%
jan 1, 2009
22.748
+0.879
4.02%
jan 1, 2010
24.655
+1.907
8.38%
jan 1, 2011
25.234
+0.579
2.35%
jan 1, 2012
26.752
+1.518
6.02%
jan 1, 2013
26.508
-0.244
-0.91%
jan 1, 2014
27.5
+0.992
3.74%
jan 1, 2015
26.381
-1.119
-4.07%
jan 1, 2016
23.899
-2.482
-9.41%
Ranking of countries by current statistics by years


Comments: