29
/
en
AIzaSyAYiBZKx7MnpbEhh9jyipgxe19OcubqV5w
April 1, 2024
109729
Congo, Dem. Rep.
COD
true
2
1
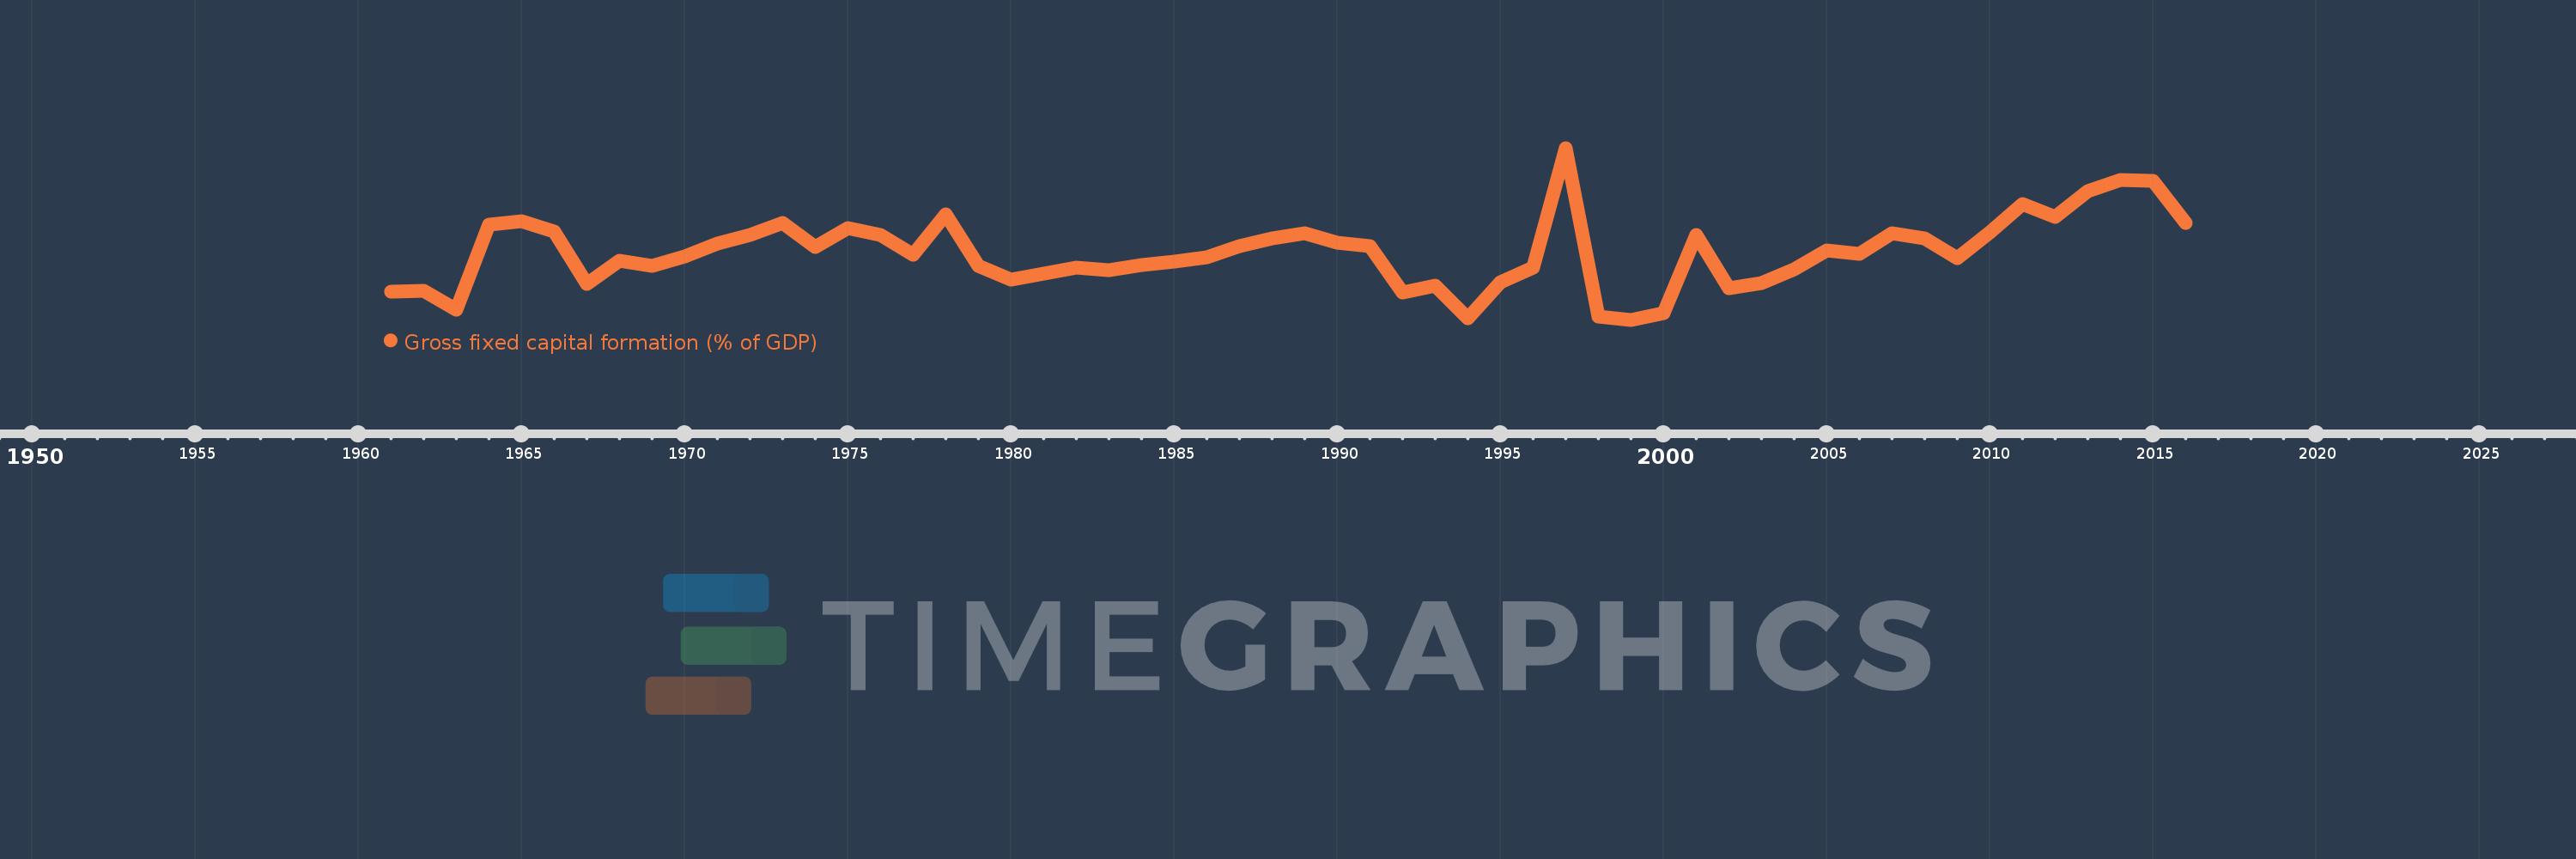
Gross fixed capital formation (% of GDP)
2016,2015,2014,2013,2012,2011,2010,2009,2008,2007,2006,2005,2004,2003,2002,2001,2000,1999,1998,1997,1996,1995,1994,1993,1992,1991,1990,1989,1988,1987,1986,1985,1984,1983,1982,1981,1980,1979,1978,1977,1976,1975,1974,1973,1972,1971,1970,1969,1968,1967,1966,1965,1964,1963,1962,1961
This statistics in other country:
AfghanistanAlbaniaAlgeriaAngolaAntigua and BarbudaArab WorldArgentinaArmeniaArubaAustraliaAustriaAzerbaijanBahamas, TheBahrainBangladeshBarbadosBelarusBelgiumBelizeBeninBermudaBhutanBoliviaBosnia and HerzegovinaBotswanaBrazilBrunei DarussalamBulgariaBurkina FasoBurundiCabo VerdeCambodiaCameroonCanadaCaribbean small statesCentral African RepublicCentral Europe and the BalticsChadChileChinaColombiaComorosCongo, Dem. Rep.Congo, Rep.Costa RicaCote d'IvoireCroatiaCubaCyprusCzech RepublicDenmarkDjiboutiDominicaDominican RepublicEarly-demographic dividendEast Asia & PacificEast Asia & Pacific (excluding high income)East Asia & Pacific (IDA & IBRD countries)EcuadorEgypt, Arab Rep.El SalvadorEquatorial GuineaEritreaEstoniaEthiopiaEuro areaEurope & Central AsiaEurope & Central Asia (excluding high income)Europe & Central Asia (IDA & IBRD countries)European UnionFijiFinlandFragile and conflict affected situationsFranceGabonGambia, TheGeorgiaGermanyGhanaGreeceGrenadaGuatemalaGuineaGuinea-BissauGuyanaHaitiHeavily indebted poor countries (HIPC)High incomeHondurasHong Kong SAR, ChinaHungaryIBRD onlyIcelandIDA & IBRD totalIDA blendIDA onlyIDA totalIndiaIndonesiaIran, Islamic Rep.IraqIrelandIsraelItalyJamaicaJapanJordanKazakhstanKenyaKiribatiKorea, Rep.KosovoKuwaitKyrgyz RepublicLao PDRLate-demographic dividendLatin America & Caribbean Latin America & Caribbean (excluding high income)Latin America & the Caribbean (IDA & IBRD countries)LatviaLeast developed countries: UN classificationLebanonLesothoLiberiaLibyaLithuaniaLow & middle incomeLow incomeLower middle incomeLuxembourgMacao SAR, ChinaMacedonia, FYRMadagascarMalawiMalaysiaMaldivesMaliMaltaMauritaniaMauritiusMexicoMicronesia, Fed. Sts.Middle East & North AfricaMiddle East & North Africa (excluding high income)Middle East & North Africa (IDA & IBRD countries)Middle incomeMoldovaMongoliaMontenegroMoroccoMozambiqueNamibiaNepalNetherlandsNew CaledoniaNew ZealandNicaraguaNigerNigeriaNorth AmericaNorwayOECD membersOmanPacific island small statesPakistanPanamaPapua New GuineaParaguayPeruPhilippinesPolandPortugalPost-demographic dividendPre-demographic dividendPuerto RicoRomaniaRussian FederationRwandaSaudi ArabiaSenegalSerbiaSeychellesSierra LeoneSingaporeSlovak RepublicSloveniaSolomon IslandsSomaliaSouth AfricaSouth AsiaSouth Asia (IDA & IBRD)South SudanSpainSri LankaSt. Kitts and NevisSt. LuciaSt. Vincent and the GrenadinesSub-Saharan Africa Sub-Saharan Africa (excluding high income)Sub-Saharan Africa (IDA & IBRD countries)SudanSurinameSwazilandSwedenSwitzerlandSyrian Arab RepublicTajikistanTanzaniaThailandTimor-LesteTogoTongaTrinidad and TobagoTunisiaTurkeyTurkmenistanUgandaUkraineUnited Arab EmiratesUnited KingdomUnited StatesUpper middle incomeUruguayUzbekistanVanuatuVenezuela, RBVietnamWest Bank and GazaWorldYemen, Rep.ZambiaZimbabwe Timeline:
This timeline shows a graph from 1961 to 2016 of Congo, Dem. Rep.. No data until 1960. Number of actual observations by date: 56.
Source name:
World Development Indicators
Source organization:
World Bank national accounts data, and OECD National Accounts data files.
Categories, topics:
Economy & Growth
Last updated:
apr 23, 2017
Indicators value changes by year
Maximum:
27.096
jan 1, 1997
At the date of observation
Value
Absolute change
Change from previous value
jan 1, 1961
6.139
+6.139
0.0%
jan 1, 1962
6.324
+0.185
3.01%
jan 1, 1963
3.511
-2.813
-44.48%
jan 1, 1964
15.986
+12.476
355.37%
jan 1, 1965
16.392
+0.406
2.54%
jan 1, 1966
14.934
-1.458
-8.9%
jan 1, 1967
7.374
-7.56
-50.62%
jan 1, 1968
10.644
+3.271
44.35%
jan 1, 1969
9.961
-0.684
-6.42%
jan 1, 1970
11.359
+1.399
14.04%
jan 1, 1971
13.215
+1.856
16.34%
jan 1, 1972
14.398
+1.183
8.95%
jan 1, 1973
16.187
+1.789
12.42%
jan 1, 1974
12.721
-3.465
-21.41%
jan 1, 1975
15.452
+2.731
21.47%
jan 1, 1976
14.394
-1.059
-6.85%
jan 1, 1977
11.568
-2.826
-19.63%
jan 1, 1978
17.492
+5.924
51.21%
jan 1, 1979
9.97
-7.523
-43.01%
jan 1, 1980
7.901
-2.069
-20.75%
jan 1, 1981
8.817
+0.917
11.6%
jan 1, 1982
9.635
+0.817
9.27%
jan 1, 1983
9.309
-0.325
-3.38%
jan 1, 1984
10.082
+0.773
8.3%
jan 1, 1985
10.595
+0.513
5.09%
jan 1, 1986
11.153
+0.557
5.26%
jan 1, 1987
12.819
+1.666
14.94%
jan 1, 1988
13.884
+1.065
8.3%
jan 1, 1989
14.668
+0.784
5.65%
jan 1, 1990
13.309
-1.359
-9.26%
jan 1, 1991
12.845
-0.464
-3.49%
jan 1, 1992
6.096
-6.749
-52.54%
jan 1, 1993
7.108
+1.012
16.6%
jan 1, 1994
2.251
-4.857
-68.33%
jan 1, 1995
7.545
+5.294
235.21%
jan 1, 1996
9.654
+2.109
27.95%
jan 1, 1997
27.096
+17.442
180.68%
jan 1, 1998
2.5
-24.596
-90.77%
jan 1, 1999
2.1
-0.4
-16.0%
jan 1, 2000
3.069
+0.969
46.14%
jan 1, 2001
14.418
+11.349
369.8%
jan 1, 2002
6.664
-7.755
-53.78%
jan 1, 2003
7.429
+0.765
11.49%
jan 1, 2004
9.425
+1.996
26.87%
jan 1, 2005
12.143
+2.717
28.83%
jan 1, 2006
11.675
-0.467
-3.85%
jan 1, 2007
14.743
+3.068
26.27%
jan 1, 2008
13.922
-0.82
-5.56%
jan 1, 2009
11.072
-2.851
-20.48%
jan 1, 2010
14.799
+3.727
33.66%
jan 1, 2011
18.916
+4.117
27.82%
jan 1, 2012
17.037
-1.878
-9.93%
jan 1, 2013
20.847
+3.81
22.36%
jan 1, 2014
22.392
+1.545
7.41%
jan 1, 2015
22.332
-0.06
-0.27%
jan 1, 2016
16.147
-6.185
-27.69%
Ranking of countries by current statistics by years


Comments: