29
/
en
AIzaSyAYiBZKx7MnpbEhh9jyipgxe19OcubqV5w
April 1, 2024
167552
Kenya
KEN
true
2
1
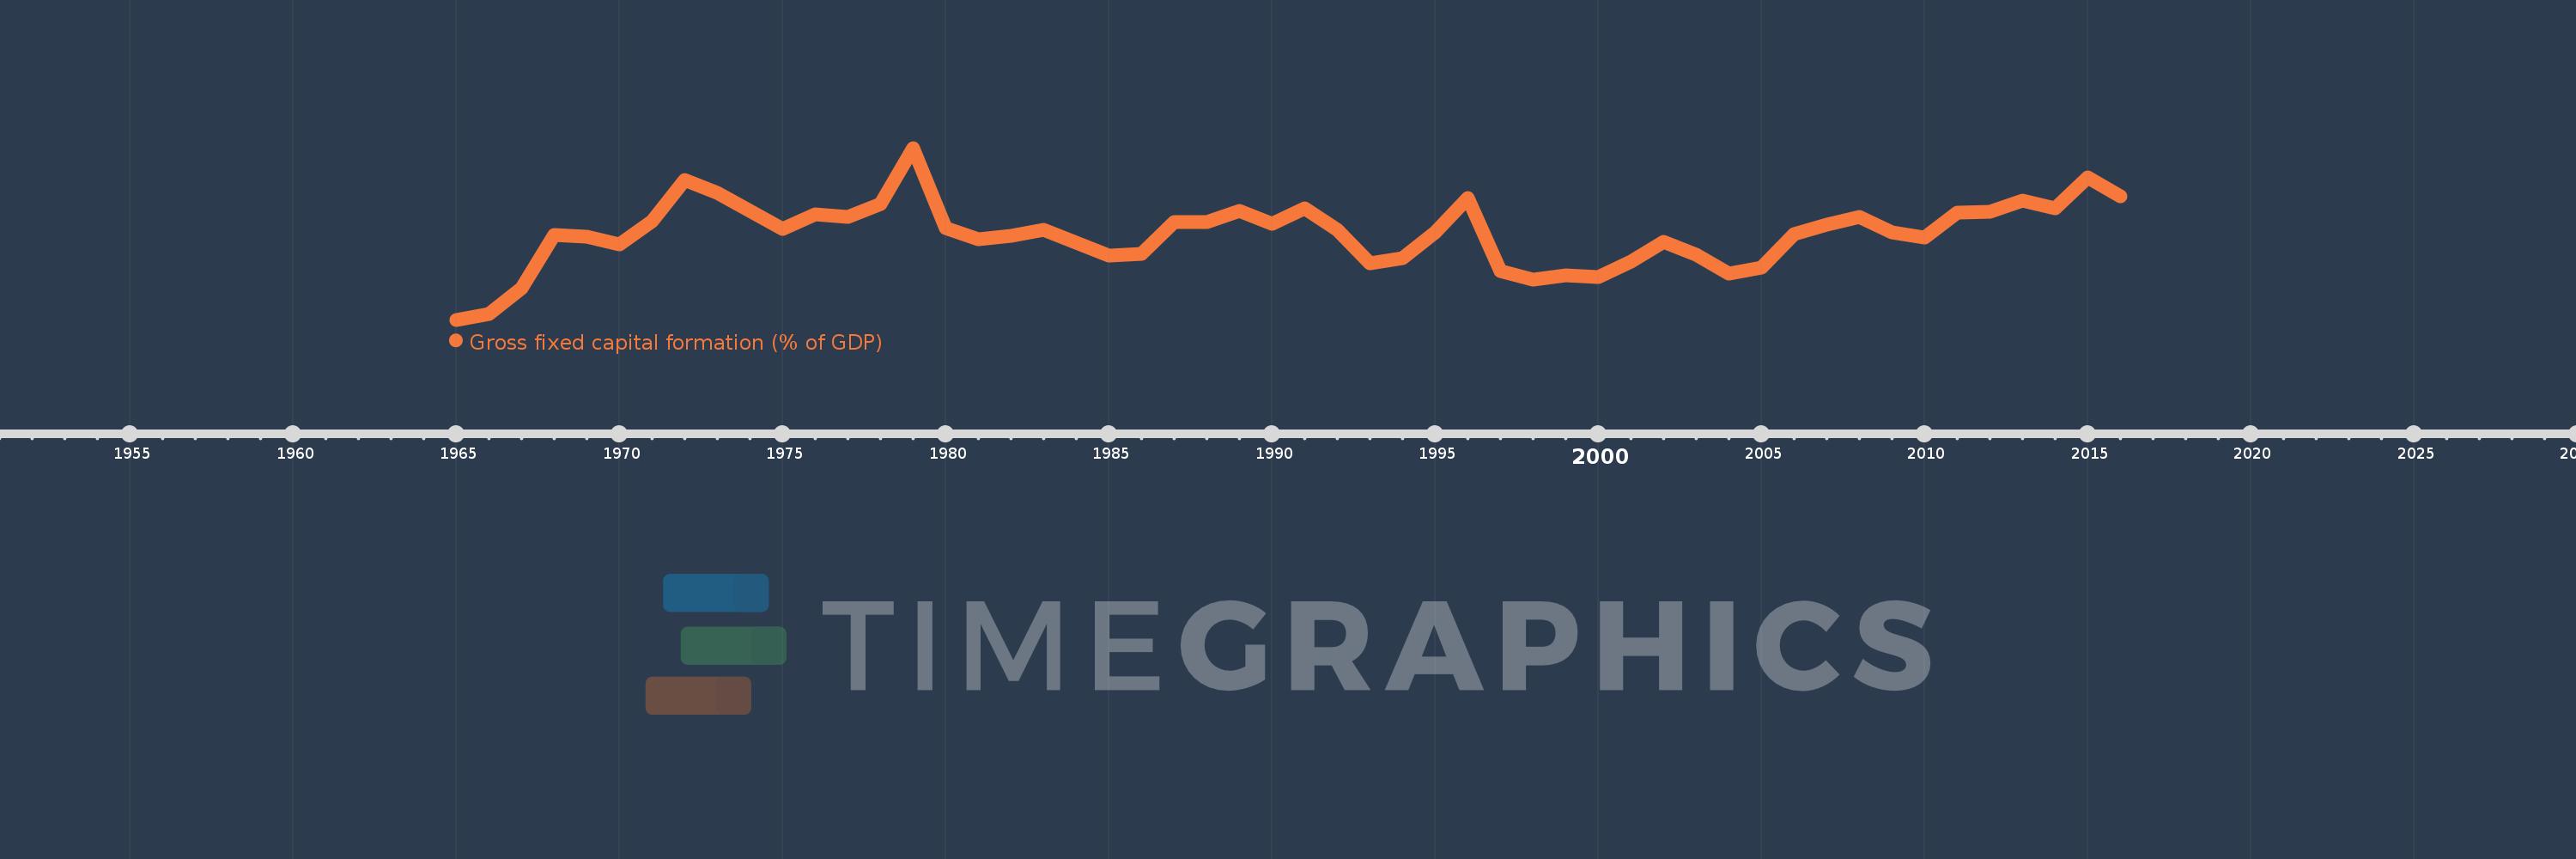
Gross fixed capital formation (% of GDP)
2016,2015,2014,2013,2012,2011,2010,2009,2008,2007,2006,2005,2004,2003,2002,2001,2000,1999,1998,1997,1996,1995,1994,1993,1992,1991,1990,1989,1988,1987,1986,1985,1984,1983,1982,1981,1980,1979,1978,1977,1976,1975,1974,1973,1972,1971,1970,1969,1968,1967,1966,1965
This statistics in other country:
AfghanistanAlbaniaAlgeriaAngolaAntigua and BarbudaArab WorldArgentinaArmeniaArubaAustraliaAustriaAzerbaijanBahamas, TheBahrainBangladeshBarbadosBelarusBelgiumBelizeBeninBermudaBhutanBoliviaBosnia and HerzegovinaBotswanaBrazilBrunei DarussalamBulgariaBurkina FasoBurundiCabo VerdeCambodiaCameroonCanadaCaribbean small statesCentral African RepublicCentral Europe and the BalticsChadChileChinaColombiaComorosCongo, Dem. Rep.Congo, Rep.Costa RicaCote d'IvoireCroatiaCubaCyprusCzech RepublicDenmarkDjiboutiDominicaDominican RepublicEarly-demographic dividendEast Asia & PacificEast Asia & Pacific (excluding high income)East Asia & Pacific (IDA & IBRD countries)EcuadorEgypt, Arab Rep.El SalvadorEquatorial GuineaEritreaEstoniaEthiopiaEuro areaEurope & Central AsiaEurope & Central Asia (excluding high income)Europe & Central Asia (IDA & IBRD countries)European UnionFijiFinlandFragile and conflict affected situationsFranceGabonGambia, TheGeorgiaGermanyGhanaGreeceGrenadaGuatemalaGuineaGuinea-BissauGuyanaHaitiHeavily indebted poor countries (HIPC)High incomeHondurasHong Kong SAR, ChinaHungaryIBRD onlyIcelandIDA & IBRD totalIDA blendIDA onlyIDA totalIndiaIndonesiaIran, Islamic Rep.IraqIrelandIsraelItalyJamaicaJapanJordanKazakhstanKenyaKiribatiKorea, Rep.KosovoKuwaitKyrgyz RepublicLao PDRLate-demographic dividendLatin America & Caribbean Latin America & Caribbean (excluding high income)Latin America & the Caribbean (IDA & IBRD countries)LatviaLeast developed countries: UN classificationLebanonLesothoLiberiaLibyaLithuaniaLow & middle incomeLow incomeLower middle incomeLuxembourgMacao SAR, ChinaMacedonia, FYRMadagascarMalawiMalaysiaMaldivesMaliMaltaMauritaniaMauritiusMexicoMicronesia, Fed. Sts.Middle East & North AfricaMiddle East & North Africa (excluding high income)Middle East & North Africa (IDA & IBRD countries)Middle incomeMoldovaMongoliaMontenegroMoroccoMozambiqueNamibiaNepalNetherlandsNew CaledoniaNew ZealandNicaraguaNigerNigeriaNorth AmericaNorwayOECD membersOmanPacific island small statesPakistanPanamaPapua New GuineaParaguayPeruPhilippinesPolandPortugalPost-demographic dividendPre-demographic dividendPuerto RicoRomaniaRussian FederationRwandaSaudi ArabiaSenegalSerbiaSeychellesSierra LeoneSingaporeSlovak RepublicSloveniaSolomon IslandsSomaliaSouth AfricaSouth AsiaSouth Asia (IDA & IBRD)South SudanSpainSri LankaSt. Kitts and NevisSt. LuciaSt. Vincent and the GrenadinesSub-Saharan Africa Sub-Saharan Africa (excluding high income)Sub-Saharan Africa (IDA & IBRD countries)SudanSurinameSwazilandSwedenSwitzerlandSyrian Arab RepublicTajikistanTanzaniaThailandTimor-LesteTogoTongaTrinidad and TobagoTunisiaTurkeyTurkmenistanUgandaUkraineUnited Arab EmiratesUnited KingdomUnited StatesUpper middle incomeUruguayUzbekistanVanuatuVenezuela, RBVietnamWest Bank and GazaWorldYemen, Rep.ZambiaZimbabwe Timeline:
This timeline shows a graph from 1965 to 2016 of Kenya. No data until 1964. Number of actual observations by date: 52.
Source name:
World Development Indicators
Source organization:
World Bank national accounts data, and OECD National Accounts data files.
Categories, topics:
Economy & Growth
Last updated:
apr 23, 2017
Indicators value changes by year
Minimum:
12.419
jan 1, 1965
Maximum:
25.076
jan 1, 1979
At the date of observation
Value
Absolute change
Change from previous value
jan 1, 1965
12.419
+12.419
0.0%
jan 1, 1966
12.823
+0.403
3.25%
jan 1, 1967
14.715
+1.892
14.76%
jan 1, 1968
18.673
+3.958
26.9%
jan 1, 1969
18.518
-0.156
-0.83%
jan 1, 1970
17.99
-0.528
-2.85%
jan 1, 1971
19.682
+1.692
9.41%
jan 1, 1972
22.704
+3.022
15.35%
jan 1, 1973
21.759
-0.944
-4.16%
jan 1, 1974
20.45
-1.31
-6.02%
jan 1, 1975
19.119
-1.33
-6.51%
jan 1, 1976
20.213
+1.094
5.72%
jan 1, 1977
19.98
-0.233
-1.15%
jan 1, 1978
20.969
+0.989
4.95%
jan 1, 1979
25.076
+4.107
19.59%
jan 1, 1980
19.171
-5.905
-23.55%
jan 1, 1981
18.323
-0.849
-4.43%
jan 1, 1982
18.611
+0.289
1.57%
jan 1, 1983
19.028
+0.416
2.24%
jan 1, 1984
18.115
-0.913
-4.8%
jan 1, 1985
17.153
-0.961
-5.31%
jan 1, 1986
17.271
+0.118
0.69%
jan 1, 1987
19.636
+2.365
13.69%
jan 1, 1988
19.626
-0.01
-0.05%
jan 1, 1989
20.447
+0.821
4.18%
jan 1, 1990
19.458
-0.989
-4.84%
jan 1, 1991
20.648
+1.19
6.12%
jan 1, 1992
19.03
-1.618
-7.84%
jan 1, 1993
16.581
-2.449
-12.87%
jan 1, 1994
16.938
+0.356
2.15%
jan 1, 1995
18.873
+1.935
11.43%
jan 1, 1996
21.386
+2.513
13.31%
jan 1, 1997
16.009
-5.377
-25.14%
jan 1, 1998
15.388
-0.621
-3.88%
jan 1, 1999
15.675
+0.287
1.87%
jan 1, 2000
15.591
-0.084
-0.53%
jan 1, 2001
16.709
+1.117
7.17%
jan 1, 2002
18.152
+1.443
8.63%
jan 1, 2003
17.237
-0.915
-5.04%
jan 1, 2004
15.838
-1.399
-8.11%
jan 1, 2005
16.259
+0.421
2.66%
jan 1, 2006
18.699
+2.44
15.01%
jan 1, 2007
19.424
+0.725
3.88%
jan 1, 2008
19.965
+0.54
2.78%
jan 1, 2009
18.865
-1.1
-5.51%
jan 1, 2010
18.505
-0.36
-1.91%
jan 1, 2011
20.322
+1.817
9.82%
jan 1, 2012
20.391
+0.069
0.34%
jan 1, 2013
21.209
+0.818
4.01%
jan 1, 2014
20.599
-0.61
-2.88%
jan 1, 2015
22.927
+2.328
11.3%
jan 1, 2016
21.518
-1.408
-6.14%
Ranking of countries by current statistics by years


Comments: