29
/
en
AIzaSyAYiBZKx7MnpbEhh9jyipgxe19OcubqV5w
April 1, 2024
144430
Guatemala
GTM
true
2
1
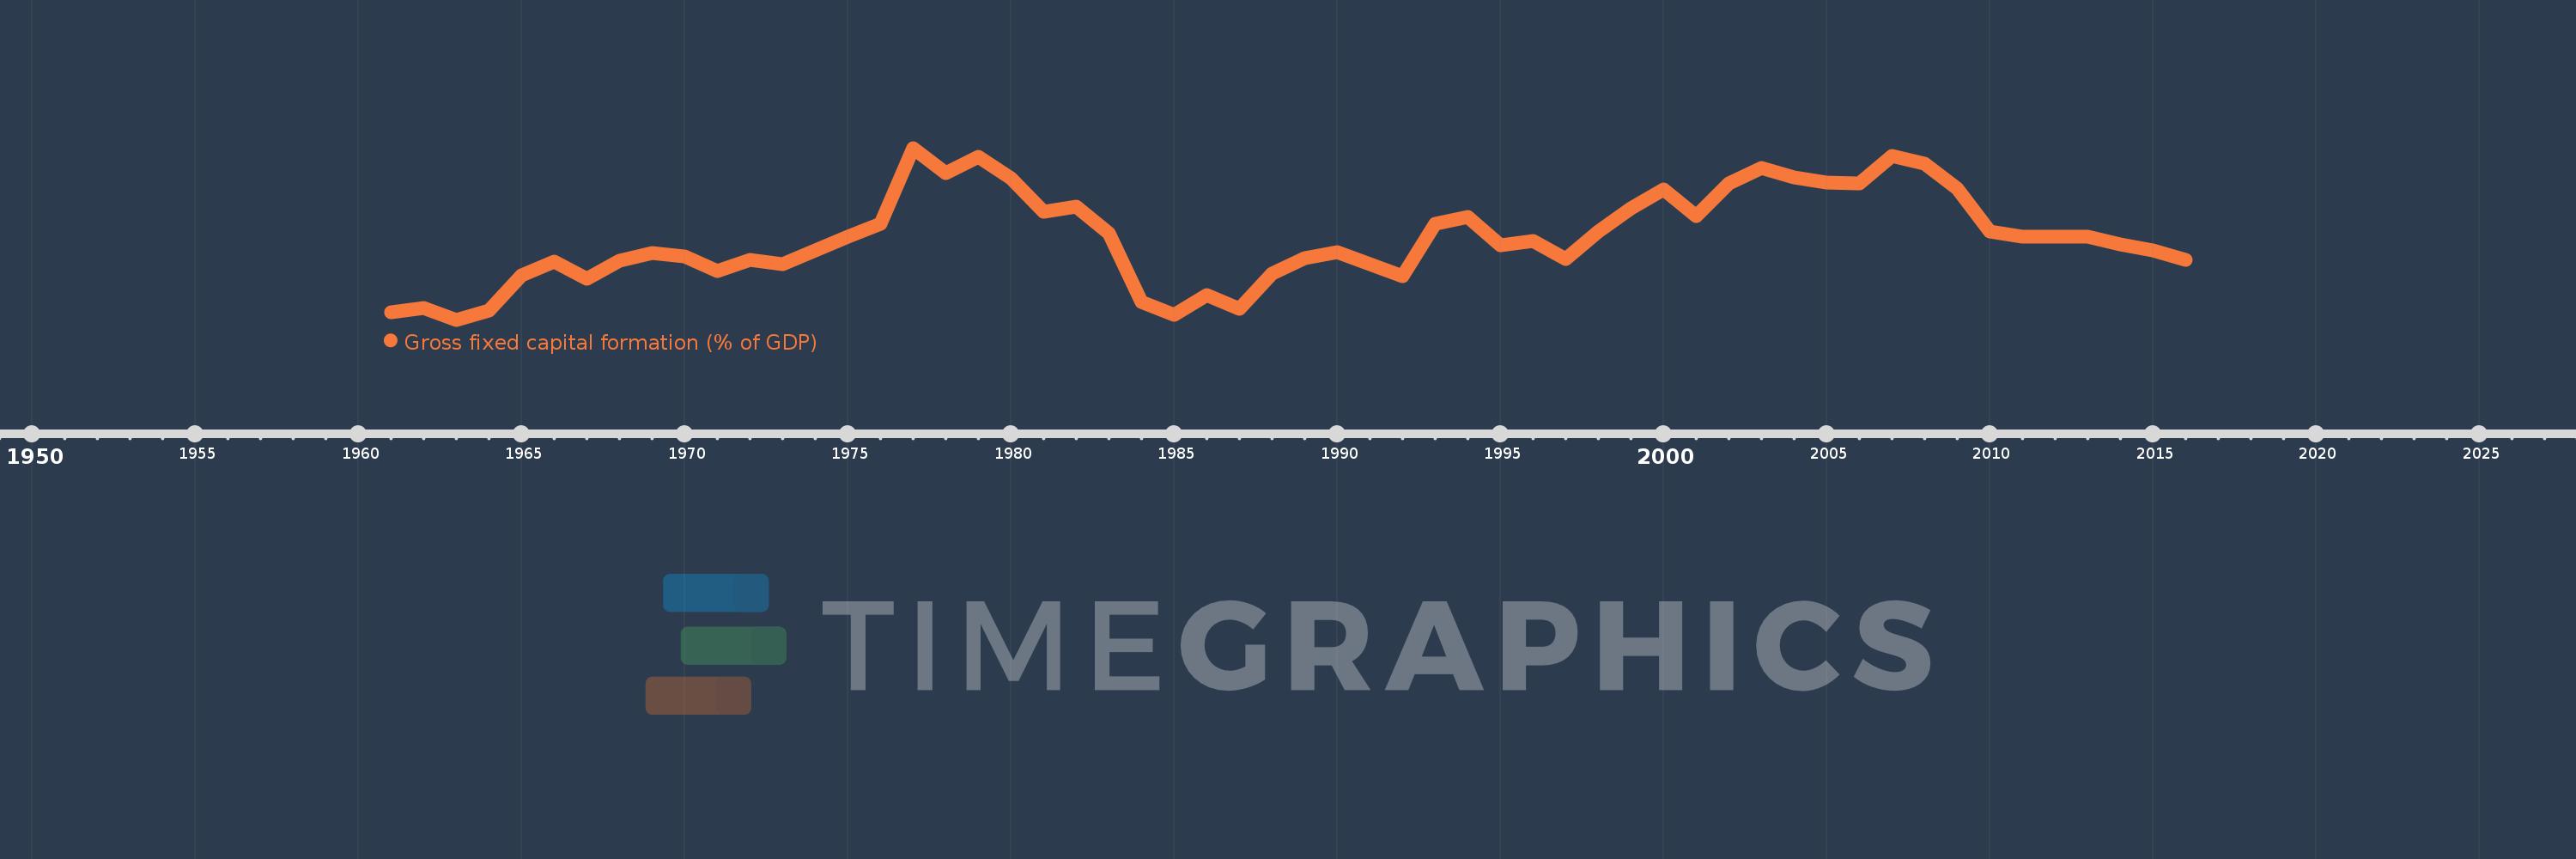
Gross fixed capital formation (% of GDP)
2016,2015,2014,2013,2012,2011,2010,2009,2008,2007,2006,2005,2004,2003,2002,2001,2000,1999,1998,1997,1996,1995,1994,1993,1992,1991,1990,1989,1988,1987,1986,1985,1984,1983,1982,1981,1980,1979,1978,1977,1976,1975,1974,1973,1972,1971,1970,1969,1968,1967,1966,1965,1964,1963,1962,1961
This statistics in other country:
AfghanistanAlbaniaAlgeriaAngolaAntigua and BarbudaArab WorldArgentinaArmeniaArubaAustraliaAustriaAzerbaijanBahamas, TheBahrainBangladeshBarbadosBelarusBelgiumBelizeBeninBermudaBhutanBoliviaBosnia and HerzegovinaBotswanaBrazilBrunei DarussalamBulgariaBurkina FasoBurundiCabo VerdeCambodiaCameroonCanadaCaribbean small statesCentral African RepublicCentral Europe and the BalticsChadChileChinaColombiaComorosCongo, Dem. Rep.Congo, Rep.Costa RicaCote d'IvoireCroatiaCubaCyprusCzech RepublicDenmarkDjiboutiDominicaDominican RepublicEarly-demographic dividendEast Asia & PacificEast Asia & Pacific (excluding high income)East Asia & Pacific (IDA & IBRD countries)EcuadorEgypt, Arab Rep.El SalvadorEquatorial GuineaEritreaEstoniaEthiopiaEuro areaEurope & Central AsiaEurope & Central Asia (excluding high income)Europe & Central Asia (IDA & IBRD countries)European UnionFijiFinlandFragile and conflict affected situationsFranceGabonGambia, TheGeorgiaGermanyGhanaGreeceGrenadaGuatemalaGuineaGuinea-BissauGuyanaHaitiHeavily indebted poor countries (HIPC)High incomeHondurasHong Kong SAR, ChinaHungaryIBRD onlyIcelandIDA & IBRD totalIDA blendIDA onlyIDA totalIndiaIndonesiaIran, Islamic Rep.IraqIrelandIsraelItalyJamaicaJapanJordanKazakhstanKenyaKiribatiKorea, Rep.KosovoKuwaitKyrgyz RepublicLao PDRLate-demographic dividendLatin America & Caribbean Latin America & Caribbean (excluding high income)Latin America & the Caribbean (IDA & IBRD countries)LatviaLeast developed countries: UN classificationLebanonLesothoLiberiaLibyaLithuaniaLow & middle incomeLow incomeLower middle incomeLuxembourgMacao SAR, ChinaMacedonia, FYRMadagascarMalawiMalaysiaMaldivesMaliMaltaMauritaniaMauritiusMexicoMicronesia, Fed. Sts.Middle East & North AfricaMiddle East & North Africa (excluding high income)Middle East & North Africa (IDA & IBRD countries)Middle incomeMoldovaMongoliaMontenegroMoroccoMozambiqueNamibiaNepalNetherlandsNew CaledoniaNew ZealandNicaraguaNigerNigeriaNorth AmericaNorwayOECD membersOmanPacific island small statesPakistanPanamaPapua New GuineaParaguayPeruPhilippinesPolandPortugalPost-demographic dividendPre-demographic dividendPuerto RicoRomaniaRussian FederationRwandaSaudi ArabiaSenegalSerbiaSeychellesSierra LeoneSingaporeSlovak RepublicSloveniaSolomon IslandsSomaliaSouth AfricaSouth AsiaSouth Asia (IDA & IBRD)South SudanSpainSri LankaSt. Kitts and NevisSt. LuciaSt. Vincent and the GrenadinesSub-Saharan Africa Sub-Saharan Africa (excluding high income)Sub-Saharan Africa (IDA & IBRD countries)SudanSurinameSwazilandSwedenSwitzerlandSyrian Arab RepublicTajikistanTanzaniaThailandTimor-LesteTogoTongaTrinidad and TobagoTunisiaTurkeyTurkmenistanUgandaUkraineUnited Arab EmiratesUnited KingdomUnited StatesUpper middle incomeUruguayUzbekistanVanuatuVenezuela, RBVietnamWest Bank and GazaWorldYemen, Rep.ZambiaZimbabwe Timeline:
This timeline shows a graph from 1961 to 2016 of Guatemala. No data until 1960. Number of actual observations by date: 56.
Source name:
World Development Indicators
Source organization:
World Bank national accounts data, and OECD National Accounts data files.
Categories, topics:
Economy & Growth
Last updated:
apr 23, 2017
Indicators value changes by year
Maximum:
20.622
jan 1, 1977
At the date of observation
Value
Absolute change
Change from previous value
jan 1, 1961
9.783
+9.783
0.0%
jan 1, 1962
10.114
+0.331
3.38%
jan 1, 1963
9.313
-0.802
-7.92%
jan 1, 1964
9.899
+0.586
6.29%
jan 1, 1965
12.262
+2.364
23.88%
jan 1, 1966
13.137
+0.874
7.13%
jan 1, 1967
12.03
-1.107
-8.42%
jan 1, 1968
13.189
+1.159
9.63%
jan 1, 1969
13.716
+0.527
4.0%
jan 1, 1970
13.466
-0.25
-1.82%
jan 1, 1971
12.532
-0.935
-6.94%
jan 1, 1972
13.281
+0.749
5.98%
jan 1, 1973
12.968
-0.313
-2.36%
jan 1, 1974
13.88
+0.912
7.03%
jan 1, 1975
14.8
+0.92
6.63%
jan 1, 1976
15.656
+0.856
5.78%
jan 1, 1977
20.622
+4.966
31.72%
jan 1, 1978
18.951
-1.671
-8.1%
jan 1, 1979
20.059
+1.108
5.85%
jan 1, 1980
18.631
-1.428
-7.12%
jan 1, 1981
16.424
-2.207
-11.84%
jan 1, 1982
16.764
+0.34
2.07%
jan 1, 1983
15.017
-1.748
-10.43%
jan 1, 1984
10.497
-4.519
-30.1%
jan 1, 1985
9.635
-0.863
-8.22%
jan 1, 1986
10.956
+1.322
13.72%
jan 1, 1987
10.059
-0.897
-8.19%
jan 1, 1988
12.356
+2.296
22.83%
jan 1, 1989
13.372
+1.016
8.22%
jan 1, 1990
13.743
+0.371
2.77%
jan 1, 1991
12.982
-0.761
-5.54%
jan 1, 1992
12.177
-0.805
-6.2%
jan 1, 1993
15.643
+3.466
28.46%
jan 1, 1994
16.087
+0.443
2.83%
jan 1, 1995
14.225
-1.861
-11.57%
jan 1, 1996
14.515
+0.289
2.03%
jan 1, 1997
13.33
-1.185
-8.16%
jan 1, 1998
15.113
+1.783
13.37%
jan 1, 1999
16.646
+1.534
10.15%
jan 1, 2000
17.892
+1.246
7.48%
jan 1, 2001
16.126
-1.766
-9.87%
jan 1, 2002
18.306
+2.18
13.52%
jan 1, 2003
19.306
+1.0
5.46%
jan 1, 2004
18.667
-0.64
-3.31%
jan 1, 2005
18.338
-0.328
-1.76%
jan 1, 2006
18.298
-0.041
-0.22%
jan 1, 2007
20.108
+1.81
9.89%
jan 1, 2008
19.588
-0.52
-2.59%
jan 1, 2009
17.932
-1.655
-8.45%
jan 1, 2010
15.13
-2.802
-15.63%
jan 1, 2011
14.808
-0.322
-2.13%
jan 1, 2012
14.8
-0.008
-0.05%
jan 1, 2013
14.79
-0.01
-0.07%
jan 1, 2014
14.254
-0.536
-3.62%
jan 1, 2015
13.856
-0.399
-2.8%
jan 1, 2016
13.237
-0.618
-4.46%
Ranking of countries by current statistics by years


Comments: