29
/
en
AIzaSyAYiBZKx7MnpbEhh9jyipgxe19OcubqV5w
April 1, 2024
73031
Australia
AUS
true
2
1
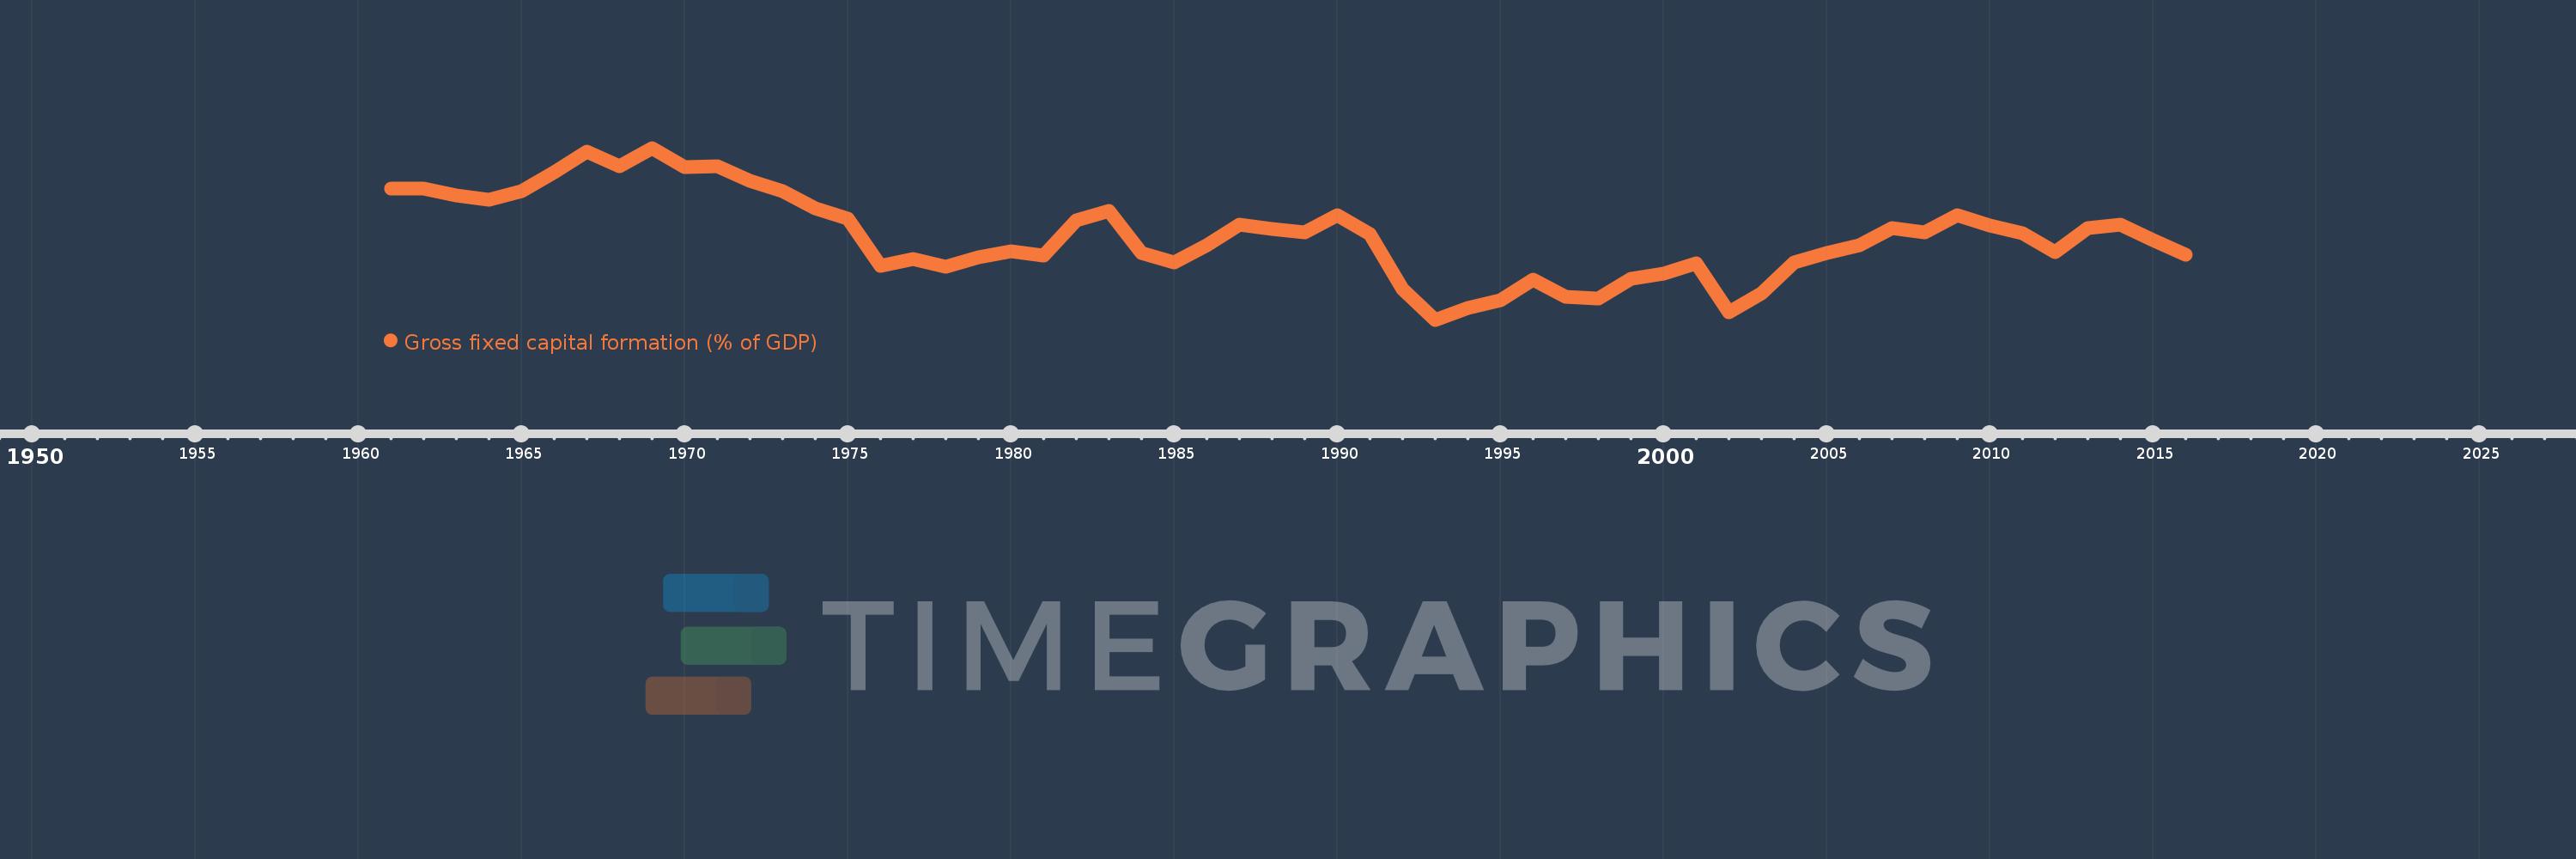
Gross fixed capital formation (% of GDP)
2016,2015,2014,2013,2012,2011,2010,2009,2008,2007,2006,2005,2004,2003,2002,2001,2000,1999,1998,1997,1996,1995,1994,1993,1992,1991,1990,1989,1988,1987,1986,1985,1984,1983,1982,1981,1980,1979,1978,1977,1976,1975,1974,1973,1972,1971,1970,1969,1968,1967,1966,1965,1964,1963,1962,1961
This statistics in other country:
AfghanistanAlbaniaAlgeriaAngolaAntigua and BarbudaArab WorldArgentinaArmeniaArubaAustraliaAustriaAzerbaijanBahamas, TheBahrainBangladeshBarbadosBelarusBelgiumBelizeBeninBermudaBhutanBoliviaBosnia and HerzegovinaBotswanaBrazilBrunei DarussalamBulgariaBurkina FasoBurundiCabo VerdeCambodiaCameroonCanadaCaribbean small statesCentral African RepublicCentral Europe and the BalticsChadChileChinaColombiaComorosCongo, Dem. Rep.Congo, Rep.Costa RicaCote d'IvoireCroatiaCubaCyprusCzech RepublicDenmarkDjiboutiDominicaDominican RepublicEarly-demographic dividendEast Asia & PacificEast Asia & Pacific (excluding high income)East Asia & Pacific (IDA & IBRD countries)EcuadorEgypt, Arab Rep.El SalvadorEquatorial GuineaEritreaEstoniaEthiopiaEuro areaEurope & Central AsiaEurope & Central Asia (excluding high income)Europe & Central Asia (IDA & IBRD countries)European UnionFijiFinlandFragile and conflict affected situationsFranceGabonGambia, TheGeorgiaGermanyGhanaGreeceGrenadaGuatemalaGuineaGuinea-BissauGuyanaHaitiHeavily indebted poor countries (HIPC)High incomeHondurasHong Kong SAR, ChinaHungaryIBRD onlyIcelandIDA & IBRD totalIDA blendIDA onlyIDA totalIndiaIndonesiaIran, Islamic Rep.IraqIrelandIsraelItalyJamaicaJapanJordanKazakhstanKenyaKiribatiKorea, Rep.KosovoKuwaitKyrgyz RepublicLao PDRLate-demographic dividendLatin America & Caribbean Latin America & Caribbean (excluding high income)Latin America & the Caribbean (IDA & IBRD countries)LatviaLeast developed countries: UN classificationLebanonLesothoLiberiaLibyaLithuaniaLow & middle incomeLow incomeLower middle incomeLuxembourgMacao SAR, ChinaMacedonia, FYRMadagascarMalawiMalaysiaMaldivesMaliMaltaMauritaniaMauritiusMexicoMicronesia, Fed. Sts.Middle East & North AfricaMiddle East & North Africa (excluding high income)Middle East & North Africa (IDA & IBRD countries)Middle incomeMoldovaMongoliaMontenegroMoroccoMozambiqueNamibiaNepalNetherlandsNew CaledoniaNew ZealandNicaraguaNigerNigeriaNorth AmericaNorwayOECD membersOmanPacific island small statesPakistanPanamaPapua New GuineaParaguayPeruPhilippinesPolandPortugalPost-demographic dividendPre-demographic dividendPuerto RicoRomaniaRussian FederationRwandaSaudi ArabiaSenegalSerbiaSeychellesSierra LeoneSingaporeSlovak RepublicSloveniaSolomon IslandsSomaliaSouth AfricaSouth AsiaSouth Asia (IDA & IBRD)South SudanSpainSri LankaSt. Kitts and NevisSt. LuciaSt. Vincent and the GrenadinesSub-Saharan Africa Sub-Saharan Africa (excluding high income)Sub-Saharan Africa (IDA & IBRD countries)SudanSurinameSwazilandSwedenSwitzerlandSyrian Arab RepublicTajikistanTanzaniaThailandTimor-LesteTogoTongaTrinidad and TobagoTunisiaTurkeyTurkmenistanUgandaUkraineUnited Arab EmiratesUnited KingdomUnited StatesUpper middle incomeUruguayUzbekistanVanuatuVenezuela, RBVietnamWest Bank and GazaWorldYemen, Rep.ZambiaZimbabwe Timeline:
This timeline shows a graph from 1961 to 2016 of Australia. No data until 1960. Number of actual observations by date: 56.
Source name:
World Development Indicators
Source organization:
World Bank national accounts data, and OECD National Accounts data files.
Categories, topics:
Economy & Growth
Last updated:
apr 23, 2017
Indicators value changes by year
Minimum:
22.867
jan 1, 1993
At the date of observation
Value
Absolute change
Change from previous value
jan 1, 1961
30.261
+30.261
0.0%
jan 1, 1962
30.269
+0.008
0.03%
jan 1, 1963
29.864
-0.405
-1.34%
jan 1, 1964
29.628
-0.236
-0.79%
jan 1, 1965
30.127
+0.5
1.69%
jan 1, 1966
31.176
+1.049
3.48%
jan 1, 1967
32.352
+1.176
3.77%
jan 1, 1968
31.513
-0.839
-2.59%
jan 1, 1969
32.56
+1.047
3.32%
jan 1, 1970
31.457
-1.103
-3.39%
jan 1, 1971
31.547
+0.09
0.29%
jan 1, 1972
30.72
-0.827
-2.62%
jan 1, 1973
30.146
-0.574
-1.87%
jan 1, 1974
29.138
-1.008
-3.34%
jan 1, 1975
28.559
-0.579
-1.99%
jan 1, 1976
25.925
-2.633
-9.22%
jan 1, 1977
26.285
+0.36
1.39%
jan 1, 1978
25.856
-0.429
-1.63%
jan 1, 1979
26.386
+0.531
2.05%
jan 1, 1980
26.748
+0.362
1.37%
jan 1, 1981
26.471
-0.277
-1.04%
jan 1, 1982
28.456
+1.985
7.5%
jan 1, 1983
29.018
+0.562
1.97%
jan 1, 1984
26.609
-2.41
-8.3%
jan 1, 1985
26.086
-0.523
-1.97%
jan 1, 1986
27.092
+1.007
3.86%
jan 1, 1987
28.221
+1.129
4.17%
jan 1, 1988
28.002
-0.219
-0.78%
jan 1, 1989
27.817
-0.186
-0.66%
jan 1, 1990
28.746
+0.929
3.34%
jan 1, 1991
27.711
-1.035
-3.6%
jan 1, 1992
24.608
-3.102
-11.2%
jan 1, 1993
22.867
-1.741
-7.07%
jan 1, 1994
23.509
+0.642
2.81%
jan 1, 1995
23.975
+0.466
1.98%
jan 1, 1996
25.126
+1.151
4.8%
jan 1, 1997
24.164
-0.961
-3.83%
jan 1, 1998
24.058
-0.106
-0.44%
jan 1, 1999
25.19
+1.132
4.7%
jan 1, 2000
25.473
+0.283
1.13%
jan 1, 2001
26.028
+0.555
2.18%
jan 1, 2002
23.285
-2.744
-10.54%
jan 1, 2003
24.366
+1.082
4.65%
jan 1, 2004
26.095
+1.729
7.1%
jan 1, 2005
26.615
+0.519
1.99%
jan 1, 2006
27.049
+0.434
1.63%
jan 1, 2007
28.034
+0.985
3.64%
jan 1, 2008
27.773
-0.261
-0.93%
jan 1, 2009
28.763
+0.99
3.56%
jan 1, 2010
28.204
-0.559
-1.95%
jan 1, 2011
27.736
-0.468
-1.66%
jan 1, 2012
26.695
-1.041
-3.75%
jan 1, 2013
28.018
+1.323
4.96%
jan 1, 2014
28.251
+0.233
0.83%
jan 1, 2015
27.336
-0.915
-3.24%
jan 1, 2016
26.524
-0.812
-2.97%
Ranking of countries by current statistics by years


Comments: