29
/
en
AIzaSyAYiBZKx7MnpbEhh9jyipgxe19OcubqV5w
April 1, 2024
281033
Venezuela, RB
VEN
true
2
1
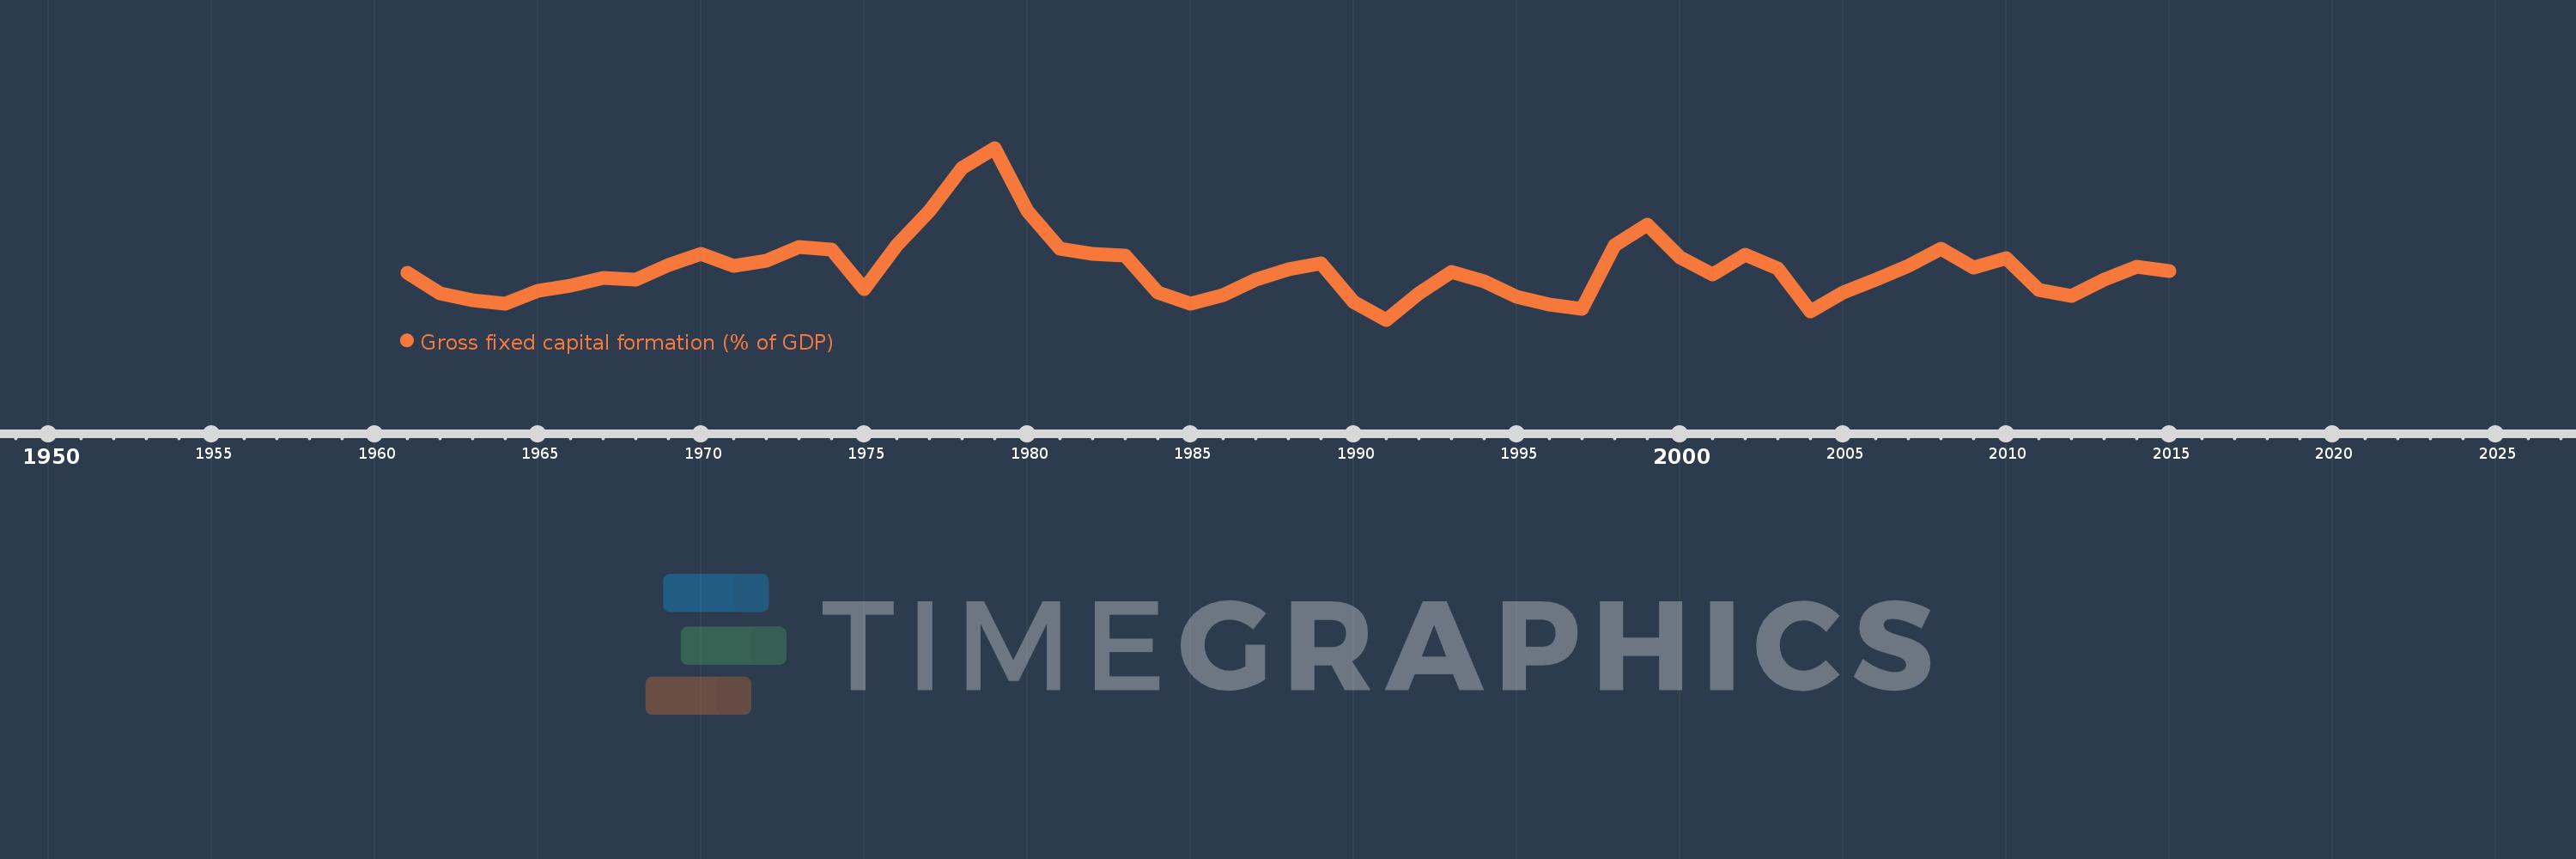
Gross fixed capital formation (% of GDP)
2015,2014,2013,2012,2011,2010,2009,2008,2007,2006,2005,2004,2003,2002,2001,2000,1999,1998,1997,1996,1995,1994,1993,1992,1991,1990,1989,1988,1987,1986,1985,1984,1983,1982,1981,1980,1979,1978,1977,1976,1975,1974,1973,1972,1971,1970,1969,1968,1967,1966,1965,1964,1963,1962,1961
This statistics in other country:
AfghanistanAlbaniaAlgeriaAngolaAntigua and BarbudaArab WorldArgentinaArmeniaArubaAustraliaAustriaAzerbaijanBahamas, TheBahrainBangladeshBarbadosBelarusBelgiumBelizeBeninBermudaBhutanBoliviaBosnia and HerzegovinaBotswanaBrazilBrunei DarussalamBulgariaBurkina FasoBurundiCabo VerdeCambodiaCameroonCanadaCaribbean small statesCentral African RepublicCentral Europe and the BalticsChadChileChinaColombiaComorosCongo, Dem. Rep.Congo, Rep.Costa RicaCote d'IvoireCroatiaCubaCyprusCzech RepublicDenmarkDjiboutiDominicaDominican RepublicEarly-demographic dividendEast Asia & PacificEast Asia & Pacific (excluding high income)East Asia & Pacific (IDA & IBRD countries)EcuadorEgypt, Arab Rep.El SalvadorEquatorial GuineaEritreaEstoniaEthiopiaEuro areaEurope & Central AsiaEurope & Central Asia (excluding high income)Europe & Central Asia (IDA & IBRD countries)European UnionFijiFinlandFragile and conflict affected situationsFranceGabonGambia, TheGeorgiaGermanyGhanaGreeceGrenadaGuatemalaGuineaGuinea-BissauGuyanaHaitiHeavily indebted poor countries (HIPC)High incomeHondurasHong Kong SAR, ChinaHungaryIBRD onlyIcelandIDA & IBRD totalIDA blendIDA onlyIDA totalIndiaIndonesiaIran, Islamic Rep.IraqIrelandIsraelItalyJamaicaJapanJordanKazakhstanKenyaKiribatiKorea, Rep.KosovoKuwaitKyrgyz RepublicLao PDRLate-demographic dividendLatin America & Caribbean Latin America & Caribbean (excluding high income)Latin America & the Caribbean (IDA & IBRD countries)LatviaLeast developed countries: UN classificationLebanonLesothoLiberiaLibyaLithuaniaLow & middle incomeLow incomeLower middle incomeLuxembourgMacao SAR, ChinaMacedonia, FYRMadagascarMalawiMalaysiaMaldivesMaliMaltaMauritaniaMauritiusMexicoMicronesia, Fed. Sts.Middle East & North AfricaMiddle East & North Africa (excluding high income)Middle East & North Africa (IDA & IBRD countries)Middle incomeMoldovaMongoliaMontenegroMoroccoMozambiqueNamibiaNepalNetherlandsNew CaledoniaNew ZealandNicaraguaNigerNigeriaNorth AmericaNorwayOECD membersOmanPacific island small statesPakistanPanamaPapua New GuineaParaguayPeruPhilippinesPolandPortugalPost-demographic dividendPre-demographic dividendPuerto RicoRomaniaRussian FederationRwandaSaudi ArabiaSenegalSerbiaSeychellesSierra LeoneSingaporeSlovak RepublicSloveniaSolomon IslandsSomaliaSouth AfricaSouth AsiaSouth Asia (IDA & IBRD)South SudanSpainSri LankaSt. Kitts and NevisSt. LuciaSt. Vincent and the GrenadinesSub-Saharan Africa Sub-Saharan Africa (excluding high income)Sub-Saharan Africa (IDA & IBRD countries)SudanSurinameSwazilandSwedenSwitzerlandSyrian Arab RepublicTajikistanTanzaniaThailandTimor-LesteTogoTongaTrinidad and TobagoTunisiaTurkeyTurkmenistanUgandaUkraineUnited Arab EmiratesUnited KingdomUnited StatesUpper middle incomeUruguayUzbekistanVanuatuVenezuela, RBVietnamWest Bank and GazaWorldYemen, Rep.ZambiaZimbabwe Timeline:
This timeline shows a graph from 1961 to 2015 of Venezuela, RB. No data until 1960. Number of actual observations by date: 55.
Source name:
World Development Indicators
Source organization:
World Bank national accounts data, and OECD National Accounts data files.
Categories, topics:
Economy & Growth
Last updated:
apr 23, 2017
Indicators value changes by year
Minimum:
14.133
jan 1, 1991
At the date of observation
Value
Absolute change
Change from previous value
jan 1, 1961
21.351
+21.351
0.0%
jan 1, 1962
18.172
-3.179
-14.89%
jan 1, 1963
17.148
-1.024
-5.63%
jan 1, 1964
16.548
-0.6
-3.5%
jan 1, 1965
18.602
+2.054
12.41%
jan 1, 1966
19.384
+0.782
4.2%
jan 1, 1967
20.526
+1.142
5.89%
jan 1, 1968
20.266
-0.26
-1.27%
jan 1, 1969
22.464
+2.199
10.85%
jan 1, 1970
24.157
+1.692
7.53%
jan 1, 1971
22.343
-1.814
-7.51%
jan 1, 1972
23.158
+0.815
3.65%
jan 1, 1973
25.276
+2.118
9.15%
jan 1, 1974
24.856
-0.421
-1.66%
jan 1, 1975
18.866
-5.989
-24.1%
jan 1, 1976
25.449
+6.583
34.89%
jan 1, 1977
30.784
+5.334
20.96%
jan 1, 1978
37.274
+6.49
21.08%
jan 1, 1979
40.33
+3.056
8.2%
jan 1, 1980
30.691
-9.638
-23.9%
jan 1, 1981
24.95
-5.742
-18.71%
jan 1, 1982
24.127
-0.823
-3.3%
jan 1, 1983
23.868
-0.258
-1.07%
jan 1, 1984
18.338
-5.53
-23.17%
jan 1, 1985
16.585
-1.753
-9.56%
jan 1, 1986
17.939
+1.355
8.17%
jan 1, 1987
20.284
+2.345
13.07%
jan 1, 1988
21.77
+1.486
7.32%
jan 1, 1989
22.767
+0.997
4.58%
jan 1, 1990
16.886
-5.881
-25.83%
jan 1, 1991
14.133
-2.753
-16.31%
jan 1, 1992
18.172
+4.039
28.58%
jan 1, 1993
21.455
+3.283
18.07%
jan 1, 1994
20.006
-1.448
-6.75%
jan 1, 1995
17.617
-2.389
-11.94%
jan 1, 1996
16.481
-1.136
-6.45%
jan 1, 1997
15.782
-0.7
-4.25%
jan 1, 1998
25.475
+9.694
61.42%
jan 1, 1999
28.569
+3.093
12.14%
jan 1, 2000
23.703
-4.866
-17.03%
jan 1, 2001
21.015
-2.688
-11.34%
jan 1, 2002
24.047
+3.033
14.43%
jan 1, 2003
21.924
-2.123
-8.83%
jan 1, 2004
15.469
-6.455
-29.44%
jan 1, 2005
18.337
+2.868
18.54%
jan 1, 2006
20.268
+1.931
10.53%
jan 1, 2007
22.334
+2.065
10.19%
jan 1, 2008
25.022
+2.688
12.04%
jan 1, 2009
22.101
-2.922
-11.68%
jan 1, 2010
23.529
+1.428
6.46%
jan 1, 2011
18.682
-4.847
-20.6%
jan 1, 2012
17.731
-0.951
-5.09%
jan 1, 2013
20.309
+2.579
14.54%
jan 1, 2014
22.218
+1.908
9.4%
jan 1, 2015
21.623
-0.595
-2.68%
Ranking of countries by current statistics by years


Comments: